Research
Optimal Corporate Investment and Capital Allocation: Insights from Research and Practice
Product
Career
Automatically translated from the Japanese original.
Overview
Where, and in what proportions, should a company deploy its resources to maximize its value? This article lines up five destinations for capital—existing businesses, new businesses, M&A and partnerships, financial assets, and shareholder returns—plus the option of simply waiting, and measures them all on the same yardstick: enterprise value (profit, risk and growth). For each destination, we summarize what the research says about expected returns, probability of success and time horizon.
Introduction
A company's value is determined by how it allocates its resources. But what procedure should you follow to work out the right allocation? Drawing on the latest research and practitioner knowledge, this article provides a comprehensive overview of the thinking and process behind allocation decisions.
This article makes three new contributions.
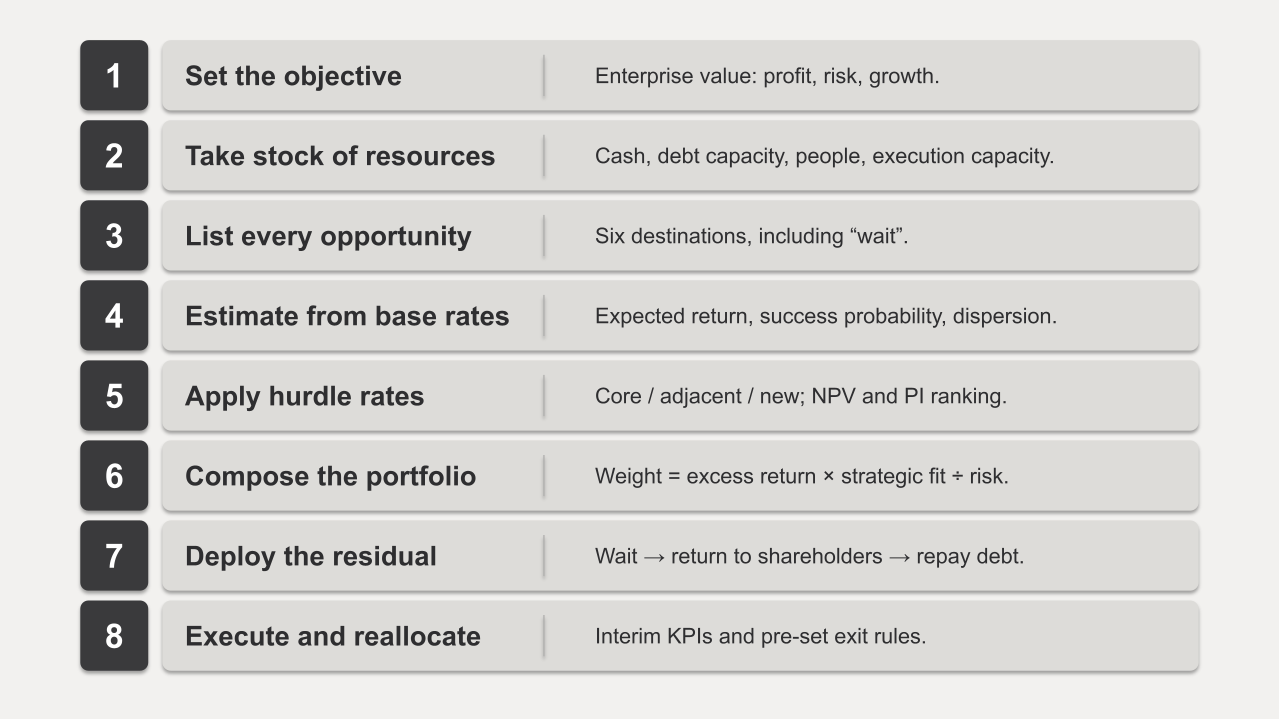
It compares every destination for corporate capital on a single yardstick and consolidates them into an eight-step procedure: We place existing businesses, new businesses, M&A, financial assets, shareholder returns and the option of waiting on the same scale of enterprise value, tabulate the figures reported in the research, and distill the whole process—from setting the objective function through to reallocation—into eight steps. For instance, the private rate of return on R&D of 20–30% (Hall et al., 2010), the near-zero average return to acquirers (Andrade et al., 2001) and the 0.5% real return on short-term government bonds (Dimson et al., 2025) are compared side by side in a single table, and allocations are weighted by expected excess return × strategic fit ÷ risk.
It shows how allocation should change with a company's stage, size and type of business: We lay out guideline allocations, with supporting evidence, across core, adjacent, new, M&A, financial assets and shareholder returns for four stages from startup to mature large enterprise, for company size (which determines how many bets you can place), and for business models ranging from capital-intensive to platform-based. For example, a startup should put almost 100% into its core, holding financial assets only for working capital, while a listed mid-sized company maps to a 70/20/10 split (Nagji & Tuff, 2012) combined with programmatic M&A—a steady stream of small acquisitions.
It organizes the latest research and practitioner trends: We bring together 2020s research—the gap between the discount rates companies use and their cost of capital, how intangible assets explain the investment gap, the relationship between share buybacks and investment, and the divergence between the on-the-ground and macroeconomic effects of generative AI—alongside the arguments of Buffett, Bezos, Leonard, Pichai, Cahn and others, presenting both sides of three debates: concentration versus diversification, returning capital versus reinvesting it, and whether AI investment has gone too far. For example, we set Alphabet's claim that "the risk of underinvesting is greater" next to Sequoia's warning of a "$600 billion revenue gap."
What Is Corporate Investment?
This chapter defines corporate investment as "capital allocation" in terms of its relationship to enterprise value, and then maps out the range of resources that can be allocated, the full landscape of investment destinations, and the basic principles of investment decisions.
What Is Capital Allocation?
Corporate investment is carried out through capital allocation—the decisions about which uses a company's resources go to, and in what amounts.
Management is capital allocation: Analyzing the tenures of eight CEOs, Thorndike (2012) found that capital has five uses—investing in existing businesses, acquisitions, debt repayment, share buybacks and dividends—and three sources—operating cash flow, debt and equity issuance—and that CEOs who systematically optimized these outperformed the S&P 500 by more than twentyfold. Henry Singleton of Teledyne, for example, delivered an annualized return of 20.4% from 1963 to 1990 (versus 11.6% for the S&P 500 over the same period), repurchasing and retiring roughly 90% of the company's outstanding shares when the stock was cheap.
Judge earning power with the one-dollar test: Buffett (1985) argued that retaining earnings (keeping profits inside the company rather than paying them out to shareholders as dividends) is justified only "when there is a reasonable prospect that each dollar retained will create at least one dollar of market value for shareholders," and Berkshire Hathaway's Owner's Manual (Buffett, 1996) codifies the same standard as an operating principle. In other words, if the incremental return on retained earnings falls short of the yield shareholders could earn on their own in the market, those earnings should be returned through dividends or buybacks.
Capital allocation determines enterprise value: Koller et al. (2020) define enterprise value as the discounted present value of future free cash flows, determined by NOPAT, the growth rate g, return on invested capital ROIC, and the weighted average cost of capital WACC (V = NOPAT × (1 − g/ROIC) ÷ (WACC − g)). Growth creates value only when ROIC exceeds WACC; when it falls short, growth actually destroys value. For example, a business with ROIC of 8% and WACC of 10% loses enterprise value even if it doubles its revenue, whereas a business with ROIC of 20% gains substantial value for every yen invested in growth.
Most capital allocation simply repeats last year's: Using data on 1,616 US listed companies from 1990 to 2005, Hall et al. (2012) showed that allocations to business units are almost frozen in place: the average correlation with the prior year's allocation was 0.92 (0.99 at roughly a third of the companies). Companies in the top third for reallocation delivered annual total shareholder returns about 30% higher than those in the bottom third, and were 13% more likely to avoid being acquired or going bankrupt. For instance, among US conglomerates, Honeywell reallocated only 25% of its capital between 1990 and 2009 and earned a 14% annual return, while Danaher reallocated 66% and earned 25% (Hall et al., 2012).
The Sources of Investment
Cash is not the only kind of capital a company can allocate as the basis for its investments. People, management time, intangible assets and the customer base are all resources that can be converted into future cash flows—and they are often tighter constraints than cash.
Financial capital: Cash on hand, operating cash flow, borrowing capacity and the capacity to issue equity are the basic sources of funds. According to Mauboussin & Callahan (2014), more than 90% of the capital raised by the top 1,500 US companies comes from internal funds, and the updated 2025 edition (Mauboussin & Callahan, 2025) puts total capital deployed by US companies in 2024 at $7.5 trillion (including $1.4 trillion in M&A and $1.5 trillion in capital expenditure). For example, a company with ¥100 billion in revenue, ¥10 billion in operating cash flow and ¥20 billion in borrowing capacity can expect to have up to around ¥30 billion of financial capital to allocate each year.
Human capital: Jagannathan et al. (2016) report that the main reason companies use hurdle rates (investment thresholds) of around 15%—roughly double their WACC of about 8%—is not a shortage of funds but "operational constraints": the limited capacity of management talent and the organization to execute. (In theory, every project returning more than the roughly 8% WACC should be undertaken, yet in practice projects returning 9–14% are passed over.) The bottleneck in allocation, in other words, is often people rather than cash. Think of a popular restaurant with only 20 seats: it does not accept every reservation from a paying customer (projects returning at least the ~8% WACC), but keeps seats open for high-spending diners ordering the full course (allocating capital only to projects returning 15% or more). It turns customers away not because it lacks money to buy ingredients, but because seats (execution capacity, i.e. human capital) are finite, and filling them all would mean losing the best customers.
Intangible assets: Haskel & Westlake (2017) point out that since the mid-1990s, US investment in intangible assets (brands, customer bases, data, software, patents and organizational systems) has exceeded investment in tangible assets (machinery, company vehicles, office buildings and the like), and they characterize intangibles by four properties: they are scalable, sunk (hard to recover), and prone to spillovers and synergies. Peters & Taylor (2017) estimate that 42% of the total capital of US companies is intangible. Even though they do not appear on the balance sheet, intangible assets are both a source of funding for the next investment and a target of it.
Existing customer base and distribution channels: A Bain study (Zook & Allen, 2003) found that more than 80% of the most successful moves into adjacent markets grew out of a deeper understanding of core customers' needs. Customer relationships are a resource that can be redeployed. Selling adjacent services to existing customers, for example, costs less per customer than acquiring new ones, so the same investment can be expected to yield a higher return.
Investment Destinations
There are five broad destinations for investment, plus the option of waiting.
Existing businesses: Investment in capacity and capability expansion, R&D, sales and marketing, people, IT and automation, intangible assets such as brands, and working capital. Expanding a factory or enlarging the sales team are typical examples.
New businesses: Investment through in-house new ventures, spin-outs, corporate venture capital, accelerators and industry–academia collaboration—for example, establishing a new division to bring existing technology to a different customer segment.
M&A and partnerships: Acquisitions, minority stakes, joint ventures, alliances and divestitures (negative investment). Examples include acquiring a company in an adjacent market or taking a minority stake in a startup with a promising technology.
Financial assets: Cash, money market funds and government bonds, corporate bonds, listed equities, VC and PE funds, real estate, crypto assets and strategic shareholdings—for example, parking surplus cash in short-term government bonds.
Shareholder returns and debt repayment: Dividends, share buybacks and debt repayment. These are also a declaration that "no projects exceeding the cost of capital remain inside the company." If a company instead retains earnings, makes negative-NPV investments or overpays for acquisitions when no such projects remain, the share price will fall and shareholders will lose money, ultimately forcing a change of management.
Waiting (not investing): When uncertainty is high, deferring an investment has value in itself (McDonald & Siegel, 1986; Dixit & Pindyck, 1994). Postponing a major capital expenditure by a year until the regulatory direction becomes clear, for example, can avoid a misguided investment.
Basic Principles of Investment Decisions
The standard tools of corporate finance are sufficient to evaluate individual investment opportunities.
NPV and IRR: The basic test for whether to make an investment is whether its net present value (NPV)—future cash flows discounted at the cost of capital—is positive. In a survey of 392 CFOs by Graham & Harvey (2001), 75.7% said they always or almost always use IRR, 74.9% NPV, and 56.7% the payback period. For example, a project requiring an initial investment of ¥1 billion and generating ¥200 million a year for eight years has an NPV of roughly +¥70 million at a 10% discount rate, and would be accepted.
Profitability index (PI): When capital is constrained, you maximize the value created from limited capital by accepting projects in descending order of NPV per yen invested (PI = NPV ÷ investment) (Brealey et al., 2022). In an earlier article (mign, 2026a), we showed a procedure for ranking automation projects by PI and accepting them until the budget runs out. For example, a project with an NPV of ¥300 million on a ¥500 million investment (PI 0.6) takes priority over one with an NPV of ¥400 million on a ¥1 billion investment (PI 0.4).
ROIC > WACC: At the business-unit level, the condition for continued investment is that return on invested capital exceeds the cost of capital. Cao et al. (2006) found that ROIC levels are highly persistent: 50% of companies with ROIC above 20% in 1994 still exceeded 20% in 2003. High growth, by contrast, is far less durable: 56% of companies growing at more than 20% had slowed to real growth of under 5% a decade later. In practice, this means that additional investment in an existing high-ROIC business will often create value more reliably than investment in a new, high-growth one.
Returns of at least twice the cost of capital: A survey by Jagannathan et al. (2016) found that companies use an average discount rate of 15.1%, roughly twice their cost of capital. Analyzing earnings-call remarks from about 2,500 companies, Gormsen & Huber (2025) showed that discount rates run about 3 percentage points above the cost of capital as perceived by the companies themselves; in the United States, this gap (the "wedge") widened from about 3 points in 2002 to about 5 points in 2020, and changes in the cost of capital take several years to feed through into discount rates. A 1-point rise in the discount rate lowers the following year's net investment rate by 0.8 points. This stickiness of the wedge explains, for example, why corporate investment does not immediately pick up when interest rates fall.
Expected Returns by Investment Destination
This section breaks down the six destinations described in the previous chapter and examines each one along four dimensions: overview, expected return, probability of success, and time horizon.
Investment in Existing Businesses
Investment in existing businesses carries the highest probability of success, because the customers, organization, and know-how are already in place, and for most companies it forms the core of capital allocation. The level of return and the ease of measuring it, however, vary widely depending on the type of investment.
Plant and Capacity Expansion
Overview: Investment in tangible assets such as factories, stores, data centers, and logistics hubs, which increases cash flow either by adding production capacity or by lowering unit costs. A typical example is adding a line to a factory whose order book exceeds its capacity.
Expected return: Moderate (roughly in line with the ROIC of the business in question; the long-run median ROIC for large U.S. companies is about 9%). In theory, a business should invest more the further its market value exceeds its replacement cost (Tobin's q > 1) (Tobin, 1969; Hayashi, 1982). Empirically, however, companies that sharply increased capital expenditure subsequently earned stock returns about 2% a year lower (Titman et al., 2004), and the gap in next-year returns between the top and bottom deciles of total-asset growth is 8.4% a year on a value-weighted basis (Cooper et al., 2008). In other words, the average capital investment earns roughly the ROIC of the existing business (Cao et al., 2006), and overinvestment earns less. Reflecting this, U.S. corporate capital expenditure has fallen from 8.8% of sales in 1970 to 6.3% in 2024 (Mauboussin & Callahan, 2025), as capital has shifted from tangible to intangible assets.
Probability of success: High (among the most reliable of all investment destinations; roughly 70–90% as a rule of thumb). The probability of finishing "on budget and on schedule," however, is below 10%. In the dataset of more than 16,000 projects compiled by Flyvbjerg & Gardner (2023), 91.5% overran their budget or schedule, and only 0.5% delivered on budget, schedule, and benefits. When demand forecasts miss, irreversible fixed costs remain, so the losses can be large. A factory where demand reaches only 80% of plan, for example, can end up with a lower profit margin than before the investment, as reduced utilization pushes up unit costs.
Time horizon: Long and hard to halt midway: one to three years from construction to operation, and three to ten years to payback. The required level also differs by industry: net capital expenditure as a share of sales exceeds 30–40% in utilities, runs at 18–26% in software, and is about 4% for the market as a whole (Damodaran, 2026). Bradley et al. (2018), for example, report that a "big move," defined as a capex ratio more than 1.7 times the industry median, raises the probability of moving into the top quintile of economic profit, so sustained aggressive investment pays off in growing markets.
Research and Development (R&D)
Overview: Investment aimed at creating new products, technologies, and processes; the core of intangible assets. Examples include a pharmaceutical company developing a drug candidate or a software company building new features.
Expected return: High (private rates of return of 20–30% a year). Summarizing half a century of empirical research, Hall et al. (2010) concluded that the private return on R&D is generally 20–30%, higher than on physical capital, and that the social return is higher still. Lucking et al. (2019) estimate a marginal social return of about 58% versus a marginal private return of about 14%, meaning the spillover to society is roughly four times the private return. Because much of the output of R&D leaks to competitors and customers, companies tend to invest less than would be socially optimal.
Probability of success: Low for any individual project (roughly 10–30%), but high at the portfolio level. Outcomes across research themes are heavily skewed, with a small number of successes carrying the overall return, so even when the average return is high, a bet on a single theme is more likely than not to end in failure. Research productivity is also declining over the long run: Bloom et al. (2020) find that U.S. research productivity is falling at more than 5% a year, and that doubling semiconductor density now requires more than 18 times as many researchers as in the early 1970s. Since the R&D spend needed to achieve the same result rises every year, holding the R&D ratio flat at last year's level means the real output steadily shrinks.
Time horizon: Results take three to ten years to show up in revenue, and longer still for basic research. As Arora et al. (2021) show, large companies have been withdrawing from basic research because they dislike seeing its results leak out, and the longer the horizon of the R&D, the more they tend to supplement it through external partnerships.
Sales and Marketing
Overview: Investment in advertising, sales promotion, salespeople, and customer acquisition, aimed at growing revenue and building customer equity. Examples include an advertising campaign for a new market or expanding the sales team.
Expected return: Low to moderate for advertising; high for investment in customer equity. In a meta-analysis of 56 studies, Sethuraman et al. (2011) found that the sales elasticity of advertising averages 0.12 in the short run and 0.24 in the long run: a 10% increase in ad spend lifts sales by only 1.2% in the short run and 2.4% in the long run, a level at which the spend cannot be recouped unless the business has high gross margins. By contrast, the firm-value elasticity of customer equity is 0.72 (Edeling et al., 2021), and a portfolio of companies ranking highest on customer satisfaction generated excess returns of about 10.8% a year from 2000 to 2014 (Fornell et al., 2016). A business with a 60% gross margin, for example, can recoup a 10% increase in ad spend from a 1.2% rise in sales, but a business with a 20% gross margin cannot.
Probability of success: Moderate (roughly 40–70%, varying greatly with the stage of the business). Advertising is known to be more effective for growing brands (elasticity 0.16) than for mature ones (0.11) (Sethuraman et al., 2011), so the same ad budget yields a lower expected value and wider variance in a mature market. Advertising that creates demand in a new market tends to succeed, whereas advertising that fights over share in a mature market is easily offset by competitors' responses.
Time horizon: The effects of advertising split into short-term (current period) and long-term (the following year onward). The long-term effect is larger but harder to measure, which is why advertising tends to be cut to hit short-term profit targets. Edeling et al. (2021) report that marketing cuts made for the sake of short-term profit are observed at 20% of companies and erode long-term value. Halting advertising to meet a quarterly profit target, for example, boosts current-period profit but reduces revenue and customer equity in subsequent years.
Talent, Training, and Management Quality
Overview: Investment in hiring, training, and improving management practices. Examples include management training for frontline supervisors or operational improvements led by outside consultants.
Expected return: High (tens of percent to several times the investment per year). Konings & Vanormelingen (2015) estimate that trained workers carry a productivity premium of 23% and a wage premium of 12%, with the roughly 11-point difference accruing to the firm. In a randomized experiment at Indian textile plants by Bloom et al. (2013), about $75,000 of management consulting raised productivity by 17% in the first year and added about $300,000 a year in profit per plant, meaning roughly four times the investment is returned every year. Improving management practices, in short, is an investment that generates large returns with far less capital than plant and equipment.
Probability of success: High (roughly 70% or more). In the experiment by Bloom et al. (2013), plants in the treatment group improved consistently, and the techniques involved were all publicly known. What separates success from failure is not money but information and organizational inertia. Bloom et al. (2017) find that management quality explains about 30% of TFP differences both within and across countries, yet many companies either do not know how much room they have to improve or know and fail to act on it.
Time horizon: The effects of training and management improvement appear within one to three years, so payback is faster than for plant or R&D. In the experiment by Bloom et al. (2013), productivity rose 17% in the first year, and treatment-group firms had opened new plants within three years.
IT, Automation, and AI
Overview: Investment in business systems, data infrastructure, automation, and AI. A typical example is automation that moves routine work from "a person checks every case" to "a person checks only the exceptions."
Expected return: High on average, but with one of the widest dispersions across companies of any investment destination. Brynjolfsson & Hitt (2000) estimated that each dollar of IT capital is associated with about $10 of market value, most of it attributable to complementary intangibles such as the organizational change that accompanies IT. For generative AI, experiments have found that deployment in customer support raised productivity by 14% on average and by 34% for less experienced agents (Brynjolfsson et al., 2025), and that it cut the time professionals spent on writing tasks by 40% while raising quality by 18% (Noy & Zhang, 2023). In an experiment with 758 consultants, for tasks within AI's area of strength, the number of tasks completed rose 12.2% and quality improved by more than 40% (Dell'Acqua et al., 2023).
Probability of success: Low to moderate (30–40% at the company level). While task-level effects are large, cases that show up in a company's profit and loss are the minority. Although 88% of organizations now use AI, only 39% report any impact on enterprise-wide EBIT, and the "high performers" that attribute 5% or more of EBIT to AI account for only about 6% (McKinsey & Company, 2025). As we discussed in an earlier article (mign, 2026b), transformations that hit their targets are the minority across digital transformation as a whole. In the Dell'Acqua et al. (2023) experiment, for example, accuracy fell by 19 percentage points on tasks outside AI's area of strength, so success hinges on which tasks it is applied to.
Time horizon: Over a one-year window, the productivity effect of IT investment looks no better than an ordinary return on capital, but over five to seven years it expands by as much as fivefold (Brynjolfsson & Hitt, 2003). In the early phase of adoption, the complementary intangible investments go unmeasured, so productivity appears to dip temporarily—the so-called "productivity J-curve" (Brynjolfsson et al., 2021). Judge an AI investment on its first-year P&L alone, for instance, and almost every project will look like a failure.
Intangible assets: brand, data, and organization
Overview: Investment in assets that rarely show up on the balance sheet—brand, customer data, software, organizational systems, and business processes. Examples include building out a customer data platform or making sustained, long-term investments in quality to build a brand.
Expected return: High (this is the investment category the market values most highly). Corrado et al. (2009) estimated that U.S. corporate investment in intangibles reached roughly $1 trillion in 1999, nearly matching tangible investment, and rose to 1.36 times tangible investment in 2000–2003. Crouzet & Eberly (2023) show that 38–69% of the "investment gap"—the sluggishness of tangible investment relative to firm value—can be explained by intangibles, meaning equity markets are pricing in returns on intangibles that exceed those on tangible assets. In 2024, for example, U.S. companies spent 13.4% of revenue on intangibles versus 6.3% on capital expenditure (Mauboussin & Callahan, 2025); intangibles are already the single largest destination for investment.
Success probability: Medium (roughly 40–60%, with a wide gap between winners and losers). Intangibles are scalable and generate synergies, but they are also sunk (unrecoverable on exit) and produce large spillovers, so the distribution of outcomes is more skewed than for tangible assets (Haskel & Westlake, 2017). Software or a brand, for example, can scale at zero marginal cost if it succeeds, but if it fails there is almost no way to sell it off and recover the money.
Time horizon: These assets take years to accumulate, and their effects arrive with a lag. According to Tambe et al. (2020), the accumulation of firm-specific intangible capital that accompanies IT ("digital capital") predicts productivity roughly three years later. An investment in data infrastructure, for instance, shows up in the P&L not the year after it is built, but several years later, once the products and automation that draw on that data are up and running.
Working capital
Overview: The management of receivables, inventory, and payables. Reducing working capital generates cash without requiring any investment, so it can be treated as a form of "negative investment." Examples include cutting days of inventory on hand or collecting receivables sooner.
Expected return: High (margins and cash improve with no additional invested capital). Deloof (2003), studying 1,009 large Belgian companies, found that shortening days sales outstanding and days of inventory is associated with higher profitability, and Shin & Soenen (1998), using data on roughly 59,000 U.S. firm-years, showed that a shorter net trade cycle raises both profitability and shareholder value. Consider a company with ¥100 billion in revenue and a working capital cycle of 60 days: shaving 10 days off that cycle frees up roughly ¥2.7 billion in cash without any investment at all.
Success probability: High (it can be executed entirely at the company's own discretion; roughly 80% or better). The certainty of the payoff is among the highest of any investment category. That said, excessive inventory cuts or delayed payments lead to stockouts and strained relationships with trading partners. Unilaterally stretching out payments to suppliers, for example, boosts cash in the short term but can undermine procurement prices and the stability of supply.
Time horizon: The effects appear within a few months, and the cash is generated once, at the moment the cycle is shortened. A reduction in the working capital cycle is best treated as a one-time release of capital, not as a profit that recurs every year.
Investing in new businesses
Investment in new businesses differs in character from investment in existing ones: the probability of success is low, and the distribution of returns is extremely skewed.
Internal new ventures
Overview: Investment in launching new products, services, or businesses using the company's existing organization, technology, and customer base. An example would be a manufacturer launching an in-house maintenance service business built on sensor data.
Expected return: Low to medium on average, but with an extremely skewed distribution (a handful of successes determine the overall result). According to McKinsey & Company (2020), companies that launched four or more new businesses over the past decade were more than twice as likely to earn returns of five times their investment or more, and about two-thirds of large-scale new businesses came from companies that had built several. The expected value for a company that launches only one venture is low; it rises the more a company repeats the same type of launch. Rather than a single bet aiming for a 5x return, for example, launching four ventures with the same capital delivers both higher expected value and more learning.
Success probability: Low (around 25%). Of the new businesses launched over the past decade, only 24% survive today as large-scale businesses (McKinsey & Company, 2020), and in Bain's study of 1,850 companies, moves into adjacent markets succeeded about 25% of the time on average, with companies that had a repeatable expansion formula succeeding roughly twice as often—around 50% (Zook & Allen, 2003). Organizational design also has a major effect: when O'Reilly & Tushman (2004) analyzed 35 breakthrough ventures, more than 90% of those run in "ambidextrous" organizations—where the exploratory unit is kept separate and integrated at the senior-management level—met their goals, compared with about 25% in functional organizations and 0% in cross-functional teams. Place a new business inside an existing one, and the existing business's metrics and processes will suffocate it (Christensen, 1997).
Time horizon: It takes three to seven years to get from launch to scale. Among new businesses more than four years past launch, at least 80% have annual revenue below $50 million, and more than half are either below $1 million or have been shut down (McKinsey & Company, 2021). Many executives say they want about half of their revenue five years out to come from new businesses, but the actual track record typically plays out over a longer horizon.
Spin-outs and carve-outs
Overview: Separating an internal business or technology into an independent company—an investment, or in some cases a divestment. The parent may continue to hold shares. An example would be spinning off a business whose customers or capital time horizon differ from those of the core business, bringing in outside capital, and setting it up to stand on its own.
Expected return: Medium (+3% at announcement; roughly in line with the market over the long run). In a meta-analysis of 26 studies, Veld & Veld-Merkoulova (2009) found an average abnormal return of +3.02% on spin-off announcements, but long-run excess returns have not been confirmed using rigorous methods. When Bain & Company (2014) analyzed 40 transactions involving companies with enterprise values above $1 billion, stock returns in the 18 months after separation did not beat the market on average. The separation itself does not create value; what determines value is what each company does afterward.
Success probability: Medium (roughly a third succeed handsomely, and a third fail badly). In the 40 cases studied by Bain & Company (2014), the top third increased their combined market capitalization by more than 50% after separation, while another third saw it fall 40% within 18 months. The successes shared a clear strategic rationale and a plan to offset dis-synergies. If it is unclear whether the purpose of the separation is "focusing on the core business" or "giving a new business outside capital and independence," the deal is more likely to land on the losing side of that split.
Time horizon: It takes 12 to 18 months from decision to completion, transaction costs run to about 1% of consolidated revenue, more than 75 dedicated staff are required, and the roughly 5% average increase in SG&A in the first year has to be offset within 12 to 24 months (Bain & Company, 2014). In practice, the results of a separation cannot be judged until at least two years after completion.
Corporate venture capital (CVC)
Overview: Minority investments in startups by operating companies. Chesbrough (2002) classified them into four types—driving, enabling, emergent, and passive—based on objective (strategic or financial) and how tightly the investment is linked to the core business. Investing in a startup whose complementary products stimulate demand for your own products, for instance, is an enabling investment.
Expected return: Medium to high when the objective is strategic; low (and potentially negative) when it is financial. Using data on 1,173 U.S. public companies, Dushnitsky & Lenox (2006) showed that CVC is positively associated with Tobin's q, but that the effect is confined to strategically motivated CVC, while financially motivated CVC can destroy value. In 2024, for example, CVCs participated in roughly 28% of venture deals worldwide, and 37% of the $65.9 billion raised went to AI (CB Insights, 2025).
Success probability: Low to medium at the level of individual portfolio companies (35% reach IPO); low at the program level (nearly half shut down within three years). Gompers & Lerner (2000) analyzed 32,364 VC investments made between 1983 and 1994 and found that CVC-backed companies reached IPO at a rate of 35.1%, higher than the 30.6% for independent VC, and 39.3% where there was a strategic fit. On the other hand, in Ma's (2020) analysis of 381 units, 46% of CVC programs were terminated within three years. Design failures—compensation below market rates, slow approvals, withdrawal whenever management changes—are what make programs short-lived (Lerner, 2013).
Time horizon: It takes five to ten years to get from investment to exit, yet the median lifespan of a CVC program is only about four years (Ma, 2020), and in the era studied by Gompers & Lerner (2000) it was about one year. Ma (2020) argues that CVC functions as a "technology window": programs are launched after in-house innovation declines and wound down once it recovers. If a program's life is shorter than the payback period on its investments, those investments end up financially unfinished.
Accelerators and studios
Overview: Investment in time-limited, intensive support programs (accelerators) or in mechanisms through which a company builds businesses in volume on its own (venture studios). An example would be running an accelerator focused on your own industry and investing in the standout participants.
Expected return: High for participating companies (47–171% more funding raised); unknown for the company running the program (no quantitative research exists). In a quasi-experiment comparing accepted applicants with those narrowly rejected, Hallen et al. (2020) found that in three of four cohorts, graduates raised 47–171% more funding two to three years later, and that the effect stemmed from intensive early learning. Participants' growth improves, but research quantifying the financial return to the operator remains scarce.
Probability of success: Medium (it depends on program design; effects were found in three of four cohorts). Programs that concentrate advice early, make progress transparent, and run on a standardized schedule show stronger effects (Hallen et al., 2020). By contrast, quantitative evidence on the outcomes of corporate accelerators is thin (Kohler, 2016), and the high success rates published by the venture-studio industry are self-reported and have not been independently verified. Figures published by an industry association, for instance, cannot be used as a basis for estimating the probability of success.
Time horizon: The program itself runs three to six months, but outcomes (funding raised, survival) can only be confirmed two to three years later (Hallen et al., 2020). The right yardstick, for example, is the survival rate and funding raised after three years, not the number of participating companies in year one.
Industry-Academia Collaboration and Joint Research
Overview: Investment in acquiring knowledge through joint research, contract research, or consulting with universities and research institutes. An example would be conducting basic research related to your own manufacturing process jointly with a university laboratory.
Expected return: Medium (it shows up as higher sales of products for new markets; there is no general estimate of the rate of return). Using panel data on Dutch firms, Belderbos et al. (2004) showed that joint R&D with universities and competitors contributes to sales growth from products for new markets, while joint R&D with suppliers and competitors contributes to growth in labor productivity. In other words, the return on a university partnership appears as exploratory new-product sales, not as efficiency gains.
Probability of success: Medium (it hinges on whether the company has the absorptive capacity to take in the results). According to the review by Perkmann et al. (2013), industry-academia collaboration is dominated by "engagement" such as joint research and consulting rather than by patents or spin-offs, and researchers' main motive is securing research resources. A company with no in-house researchers to serve as counterparts, for example, may commission research from a university and get a paper out of it, but rarely a product.
Time horizon: The closer the work is to basic research, the longer it takes to bear fruit—five years or more. As Arora et al. (2021) show, large companies have been withdrawing from basic research, and external collaboration is a way to supplement research with long time horizons. In some cases, for instance, it is more capital-efficient to bring in results early through joint research with a university than to maintain basic research in-house.
M&A and Partnerships
M&A is the largest and most volatile use of capital. The research is consistent in its conclusion: the average acquisition creates no value for the buyer, but outcomes vary enormously depending on how it is done.
Acquisitions
Overview: An investment that acquires control of another company, buying time to obtain capabilities, customers, and technology. An example would be acquiring a peer company in order to enter an adjacent market.
Expected return: Around zero on average (for the acquirer's shareholders); medium to high depending on approach. According to Andrade et al. (2001), in U.S. mergers from 1973 to 1998, the target's share price rose 16% at announcement while the acquirer's fell 0.7% (not statistically significant), for a combined gain of 1.8%. Mergers create value overall, but the gains accrue to the target's shareholders. The meta-analysis by King et al. (2004) likewise found that acquirers' post-acquisition performance deteriorates slightly on average, and Moeller et al. (2005) report that acquirers' shareholders lost a total of $240 billion (12 cents per dollar spent) between 1998 and 2001. By contrast, "programmatic" acquirers that make several small and mid-sized acquisitions every year earn excess shareholder returns about 2 percentage points per year above their peers (Daume et al., 2021), and frequent acquirers delivered total shareholder returns of 8.5% per year—more than double the 3.7% of companies that made no acquisitions (Bain & Company, 2025). For the same total acquisition spend, then, the research's average picture is this: a single large deal has an expected value of zero, while a steady stream of small deals adds 2 percentage points a year.
Probability of success: Low to medium (roughly 50% for one-off large acquisitions, about 65% for programmatic acquirers, and around 30% for achieving revenue synergies). The acquirer's share price falls at announcement in 60% of cases (Mauboussin & Callahan, 2025), and McKinsey's analysis of 160 deals found that about 70% of mergers failed to achieve their planned revenue synergies, while roughly 60% came close to achieving their cost synergies (Christofferson et al., 2004). Some 65% of programmatic acquirers earned positive excess returns, whereas one-off large acquisitions are a coin toss (Daume et al., 2021). CEO overconfidence also plays a role: overconfident CEOs are 65% more likely to make acquisitions, and the market reaction to their deals, at −0.9%, is worse than for other CEOs (−0.12%) (Malmendier & Tate, 2008). A company that does a single large deal and one that does several small deals a year, for instance, face very different odds of success even with the same total acquisition spend.
Time horizon: Integration and synergy realization take two to three years, and the advantage of frequent acquirers emerges over a decade or more. Bain & Company's (2025) analysis found that companies that acquired frequently between 2012 and 2022 delivered total shareholder returns of 8.5% per year, more than double the 3.7% of companies that made no acquisitions. Judging an acquisition by the share-price reaction at announcement, for example, obscures the differences in long-term integration capability.
Minority Investments
Overview: An investment that acquires part of another company's equity without taking control, used to anchor a partnership, gather information, or lay the groundwork for a future acquisition. An example would be taking a 10% stake in a startup that is a technology partner.
Expected return: Close to zero for the investor (high for the investee). Allen & Phillips (2000) analyzed 402 purchases of 5% or larger stakes between 1980 and 1991 and found that, when the investment was accompanied by a partnership or JV, the investee's share price rose 9.1% (versus 5.5% without one), whereas the investor's return was not statistically significant. In other words, the value of a minority stake comes not from the investment itself but from the business cooperation it enables—distribution channels, technology, information.
Probability of success: High when accompanied by a partnership, low when not. In Allen & Phillips (2000), investees in partnership-linked deals increased their investment (capital expenditure plus R&D) by 58.4% on an industry-adjusted basis over three years, while investments without a partnership showed no significant increase. A stake taken merely to preserve a trading relationship, for instance, rarely translates into either growth for the investee or value for the investor.
Time horizon: It takes about three years for the effects to show in the investee's investment and performance, and according to Ouimet (2013), such stakes are often used as a "stage" for gathering information ahead of a full acquisition. When the acquirer is vastly larger than its target, for example, a partial stake preserves the incentives of the target's management better than full integration would.
Joint Ventures (JVs)
Overview: An investment in which multiple companies pool capital to create a new company. An example would be establishing a joint venture with a local firm to enter an overseas market.
Expected return: Low to medium (comparable to M&A; the value the average JV creates for its parents is limited). Bamford et al. (2004) put the success rate of JVs on par with M&A and describe it as "not very good." The value of a JV, for example, lies in access to a partner's resources that cannot be obtained alone—distribution, licenses and permits, technology—and a JV where that access is unclear has a low expected value.
Probability of success: Medium (roughly 40–60% fall short of their potential, meaning 40–60% succeed). When McKinsey surveyed practitioners at 30 S&P 500 companies with experience of more than 300 JVs, 40–60% of completed JVs had underperformed their potential, and some had failed outright (Chao et al., 2014). Success depends on partner selection, governance design, and decision-making mechanisms. Many JVs, for example, launch after lengthy contract negotiations yet with decision-making processes and staffing still vague.
Time horizon: The first 100 days of operation after launch are argued to determine success or failure (Bamford et al., 2004), and in practice many JVs are dissolved within a few years of formation. Without exit terms (buyout and dissolution conditions) agreed at formation, for example, winding down an underperforming JV can take years.
Alliances
Overview: Business partnerships conducted with no equity relationship or only a limited one. Examples include distribution agreements and joint development agreements.
Expected return: Low to medium (the absolute amount is small because the investment is small, but the learning value as a precursor to an acquisition or new business is large). Cisco, cited by Dyer et al. (2004), combined 36 acquisitions with more than 100 alliances over ten years and grew its market capitalization by 44% a year. Alliances, in other words, are valuable less as standalone investments than as a means of learning ahead of an acquisition or new business.
Probability of success: Low to medium (most estimates put the failure rate above 50%, meaning 30–50% succeed). Estimated alliance failure rates range from 30% to 70% depending on the study, and Kale & Singh (2009) note that most estimates run well above 50%. Success depends on partner complementarity and fit, relational capital, and whether a dedicated alliance function exists. Dyer et al. (2004), for example, offer a framework for deciding whether to "ally or acquire" based on the type of synergy, the nature of the resources (ally for people-dependent resources, acquire for equipment), market uncertainty, and the presence of competitors.
Time horizon: Short—one to three years from contract to results—and easy to unwind. The recommended sequence, for example, is to learn through an alliance while market uncertainty is high and switch to an acquisition once conviction is established (Dyer et al., 2004).
Divestitures
Overview: A "negative investment" that sells or spins off an existing business, freeing up capital and management time for other uses. An example would be selling a non-core business whose ROIC persistently falls below its cost of capital.
Expected return: Medium to high (shareholder value rises at announcement, and the gain scales with deal size). Analyzing 1,305 U.S. companies in the 1990s, Mulherin & Boone (2000) showed that divestitures, not just acquisitions, raise shareholder value at announcement, with gains proportional to transaction size. The meta-analysis by Lee & Madhavan (2010) likewise found that the relationship between divestitures and performance is positive overall, and stronger on market-based measures. Bradley et al. (2018), for example, list reallocating more than 60% of capital to new or high-growth areas over ten years as one of the "big moves" that lift a company into the top quintile.
Probability of success: High (one of the few transaction types that creates value on average; the barriers are psychological and organizational rather than a matter of execution difficulty). Birshan et al. (2013) cite an energy company with a rule of divesting 2–3% of its portfolio every year and recommend building mechanisms for "learning to let go." A rule that mechanically screens for divestiture candidates every year, for example, makes decisions less susceptible to resistance from individual business units.
Time horizon: A divestiture takes 12 to 18 months from decision to completion, and value is realized only once the proceeds have been redeployed. If, for example, the sale proceeds simply sit in cash, they are worth less than a dollar per dollar in the sense of Faulkender & Wang (2006).
Investing in Financial Assets
For an operating company, financial assets are a way to secure liquidity and park surplus cash until the next investment opportunity comes along.
Cash, Money Market Funds, and Government Bonds
Overview: These are the safest and most liquid assets, held as working capital, as a buffer against contingencies, and as dry powder for future investment opportunities. A typical example is holding the equivalent of six months of fixed costs in bank deposits and short-term government bonds.
Expected return: Low (0.5–1.0% per year in real terms; worth $0.94 or less per dollar to shareholders). According to Dimson et al. (2025), using data from 1900 to 2024, short-term government bills delivered a real return of 0.5% per year on a global average basis, while long-term government bonds delivered 1.7%. Jordà et al. (2019), covering 16 countries from 1870 to 2015, likewise estimate real returns of 1.0% for bills and 2.5% for government bonds. The marginal value of a dollar of corporate cash to shareholders averages $0.94 (Faulkender & Wang, 2006), and falls to just $0.42–0.88 at firms with weak governance (Dittmar & Mahrt-Smith, 2007). To illustrate: in an environment with 2% inflation, cash left idle for a year loses 2% of its real value annually.
Probability of success: High (the highest certainty of principal of any asset, though not zero risk). After the U.S. bank failures of March 2023, 45% of corporate treasurers moved deposits to large banks, and roughly 80% of corporate cash is now concentrated in bank deposits, government money market funds, and government bonds (Association for Financial Professionals, 2024). At a minimum, managing cash holdings means spreading deposits across several banks and staying mindful of deposit insurance limits.
Time horizon: Cash is available immediately and is the most suitable form of dry powder. The longer it waits, however, the more opportunity cost accumulates. Cash held without a defined purpose, a deadline, and a ceiling above which it will be returned to shareholders amounts to a lack of discipline in the sense of Jensen (1986).
Corporate Bonds
Overview: Corporate bonds offer a higher yield than government bonds in exchange for taking on credit risk. A typical example is a laddered portfolio of highly rated bonds with maturities of one to three years.
Expected return: Low (1.7–2.5% per year in real terms; a spread of one to two percentage points over short-term government bills). Long-run data by asset class show bonds as a whole delivering real returns of 1.7–2.5% per year—far below equities (5–7%) and only one to two points above short-term government bills (Dimson et al., 2025; Jordà et al., 2019). In other words, the extra yield corporate bonds provide is roughly one percentage point a year, which is a rounding error compared with investment opportunities in the core business.
Probability of success: High (principal is highly secure for highly rated issues). Rising interest rates, however, produce mark-to-market losses. If a company is forced to sell before maturity, even a supposedly safe corporate bond can lock in a loss.
Time horizon: The basic principle is to match maturities to the timing of funding needs. If, for example, funds needed in 18 months are invested in a five-year bond, the company may be sitting on an unrealized loss precisely when the money is required.
Listed Equities
Overview: This means holding shares of other listed companies as a pure financial investment—for instance, using surplus cash to buy an index-tracking mutual fund.
Expected return: Medium (5–7% per year in real terms for an index; but it adds nothing to an operating company's enterprise value). The long-run real return on equities averages 5.2% per year globally (1900–2024) and about 6.6% in the United States (Dimson et al., 2025), and 6.9% across 16 countries from 1870 to 2015 (Jordà et al., 2019). Yet a pure financial investment by an operating company does not raise its enterprise value, because shareholders could buy the same shares themselves. If a manufacturer buys a mutual fund, its shareholders could have bought that same fund on their own, so the company's value does not increase.
Probability of success: High for an index, low for individual stocks (around 40%). Bessembinder (2018) found that 58% of the roughly 26,000 U.S. stocks listed between 1926 and 2016 underperformed short-term Treasury bills, and that the top 4% of stocks accounted for all of the net wealth creation. The expected value of a concentrated bet on individual stocks is therefore lower than that of an index; without diversification, the average return cannot be captured.
Time horizon: Realizing the average return takes a decade or more; from 2000 to 2024, global equities delivered a real return of just 3.5% per year (Dimson et al., 2025). Because a company's sales and the stock market move with the same business cycle, there is also the risk that losses in the core business and in the portfolio coincide in a downturn. Selling shares to meet the core business's funding needs during a recession means selling at the lowest prices.
Venture Capital and Private Equity Funds
Overview: This means investing as a limited partner in venture capital or buyout funds—for example, committing capital to a VC fund that invests in the company's own industry, in pursuit of both market intelligence and financial returns.
Expected return: Medium (buyout funds: public equities plus roughly 3% per year; VC: highly variable by vintage). Harris et al. (2014), analyzing about 1,400 U.S. funds, reported that buyout funds outperformed the S&P 500 by 20–27% over the life of a fund (more than 3% per year), whereas VC funds outperformed in the 1990s and underperformed in the 2000s. According to Kaplan & Schoar (2005), average returns net of fees are roughly on par with the S&P 500. In the Cambridge Associates (2025) benchmark, for example, the 10-year pooled IRR of 2,579 U.S. VC funds was 14.57% (versus 8.91% for the Russell 2000), but the one-year figure was 3.23% (versus 26.44%).
Probability of success: Low at the individual deal level (35–45%; 55–65% of deals lose money), and selecting fund managers in advance is next to impossible. According to Kerr et al. (2014), roughly 55% of VC-backed companies end in a loss, only 6% return more than 5x, and that 6% generates about 50% of total returns. Correlation Ventures (2014), analyzing more than 20,000 deals, likewise found that 65% lost money and only 4% returned 10x or more. The gap between top- and bottom-quartile managers is 7–8 percentage points a year, but the data are so noisy that identifying superior managers in advance is virtually impossible (Korteweg & Sorensen, 2017). The strategy of "committing to managers whose previous fund was top-quartile," for instance, has stopped working for buyout funds raised since 2000 (Harris et al., 2023).
Time horizon: Fund lives exceed 10 years, and early redemption is essentially impossible. Five years after the commitment, for example, reported returns are still only provisional figures based on appraised valuations.
Real Estate
Overview: This refers to property investments made for rental income or capital appreciation, excluding operating real estate such as headquarters and factories—for example, building a rental office on idle land.
Expected return: Medium (about 7% per year in real terms—comparable to equities, but there is little reason for an operating company to hold it). According to Jordà et al. (2019), housing delivered a real total return of 7.1% per year from 1870 to 2015, on par with equities (6.9%) and with lower volatility. Over the long run, then, real estate ranks alongside equities as an asset class—but since shareholders can own it themselves, holding it on a corporate balance sheet does not raise enterprise value.
Probability of success: Medium (averages are stable, but individual properties vary widely with location and management). Within the same city, vacancy rates and rents can differ severalfold depending on distance from the station and intended use, so averages are of little use for judging a specific property.
Time horizon: Real estate is illiquid, carries high transaction costs, and demands management time. When an operating company runs a real estate business, its core investment decisions get entangled with the property cycle, and capital allocation discipline tends to slip.
Crypto Assets
Overview: This means holding crypto assets such as bitcoin as treasury assets—for example, converting part of the company's cash into bitcoin.
Expected return: Unknown (no long-run academic estimates exist). Corporate experience is sharply polarized. Strategy (formerly MicroStrategy) held 640,250 BTC as of October 2025 (acquired for a total of $47.38 billion) and continues to buy more, funded by issuing common and preferred stock. Tesla, by contrast, bought $1.5 billion of bitcoin in 2021, sold roughly 75% of it in 2022 for $936 million, and recorded a $204 million impairment that same year (Strategy, 2025; Tesla, 2023). The same asset, in other words, produces very different outcomes for a company that makes it the core of its business and one that holds it as part of its treasury.
Probability of success: Unknown (there is no track record that can serve as a base rate). The price distribution is far more extreme than that of equities, and even if one estimates a probability of success from past price movements, there is no guarantee that the distribution itself will persist.
Time horizon: Because price swings flow straight through to the income statement, crypto holdings increase the volatility of core-business earnings (and hence the discount rate) regardless of holding period. If a company earning ¥10 billion from its core business holds ¥20 billion in crypto assets, its quarterly results will be determined by crypto prices rather than by the business.
Cross-Shareholdings (Strategic Equity Holdings)
Overview: This means holding shares in other companies to maintain a trading relationship or to underpin an alliance—for example, holding shares reciprocally with a major customer or supplier.
Expected return: Low (roughly the dividend yield). As Allen & Phillips (2000) show, strategic equity stakes accompanied by alliances or joint ventures raise the investment and value of the investee company, but holdings whose sole purpose is to maintain a trading relationship earn an economic return no better than the dividend yield. If a company holds a trading partner's shares but the relationship involves no alliance or joint investment, the stake is merely "collateral" for the relationship, and the capital is locked into a low return.
Probability of success: Low (holdings without business cooperation rarely create value). The practice is shrinking around the world. In Japan, one country where cross-shareholdings have long been widespread, the cross-shareholding ratio among listed companies hit a record low for the sixth consecutive year in fiscal 2024, with the sharpest decline among operating companies (Nishiyama, 2026). Toyota, for example, decided in 2023 to sell about ¥700 billion worth of Denso shares and repurchased roughly ¥1.18 trillion of its own stock in the fiscal year ended March 2025 (Reuters, 2023; Toyota Motor Corporation, 2025).
Time horizon: Selling frees up capital immediately, but the value is not realized until the proceeds have a new home. One analysis finds that companies that sold cross-shareholdings did not clearly increase their capital expenditure or R&D (Miyajima & Saito, 2023); the sale is only the entry point to reallocation.
Shareholder Returns and Debt Repayment
Shareholder returns and debt repayment are, in effect, decisions *not* to invest. They are the rational outcome when no projects remain inside the company that can earn more than the cost of capital. Whether such distributions come at the expense of investment, however, has been debated for decades.
Dividends
Overview: Distributing a portion of profits to shareholders in cash, for example under a policy of paying out 30% of net income.
Expected return: Zero (a dollar is returned to shareholders as a dollar; corporate value does not increase). In the framework of Jensen (1986), however, dividends have value as a disciplining device: they reduce the free cash flow available to managers and thereby prevent wasteful investment. For a company in a mature industry with few investment opportunities, for instance, a high payout ratio contributes to corporate value.
Probability of success: High (the cash reliably reaches shareholders). The catch is that once started, a dividend becomes a sticky commitment that is hard to cut. In a survey of 384 financial executives by Brav et al. (2005), 65.4% of dividend-paying firms said they would raise new capital to fund investment projects rather than cut the dividend, and some executives even admitted to passing up positive-NPV projects in order to maintain it. Once a company raises its dividend, for example, it comes under pressure to keep paying it through a downturn, even at the cost of cutting investment.
Time horizon: Dividends can be implemented immediately and take effect immediately. But because investors expect them to continue, they are in substance a long-term commitment. A company with volatile earnings, for example, preserves more flexibility by making share buybacks, rather than a fixed dividend, its primary means of returning cash.
Share buybacks
Overview: Repurchasing the company's own shares from the market. Buybacks are more flexible than dividends, and when carried out at a discount they raise the per-share value of the remaining shareholders' holdings—for example, when management judges that the share price has fallen below the company's intrinsic value.
Expected return: Depends on price (positive if the shares are undervalued, zero if fairly valued, negative if overvalued). A buyback does not increase the value of the business; it transfers value between the shareholders who sell and those who remain. If the share price is below intrinsic value, the remaining shareholders gain; if it is above, they lose. As Buffett (2024) put it, every buyback should be price-dependent: what is sensible at a price below intrinsic value becomes foolish at a price above it. Ikenberry et al. (1995), for example, found that abnormal returns in the four years following a buyback announcement averaged 12.1%, rising to 45.3% for undervalued stocks.
Probability of success: Medium (equal to the probability that management's price judgment is right—and managers tend to flatter themselves). According to Mauboussin & Callahan (2025), in a typical quarter 50–80% of CFOs say their own shares are undervalued, which cannot all be true. Nor are buybacks a signal of improving future performance; they are better explained by the reduction in risk that accompanies declining growth opportunities (Grullon & Michaely, 2004). Almeida et al. (2016) showed that firms on track to narrowly miss EPS forecasts use buybacks to "top up" EPS and then cut capital expenditure (by roughly 10%) and employment (by roughly 5%). Because buybacks undertaken to hit EPS targets are carried out regardless of price, for example, they have a low probability of creating value.
Time horizon: Execution is immediate, but whether a buyback has come at the expense of investment can only be judged over a span of years. Lazonick (2014) criticized the fact that 449 companies in the S&P 500 devoted 54% of their profits ($2.4 trillion) to buybacks and 37% to dividends between 2003 and 2012; Fried & Wang (2019) countered that net payouts, after subtracting share issuance, came to only 41% of net income across all listed companies, and that R&D and capital expenditure both rose over the same period. In 2024, for example, S&P 500 buybacks reached a record $942.5 billion, with the top 20 companies accounting for roughly half of that total (S&P Dow Jones Indices, 2025).
Debt repayment
Overview: Paying down loans or bonds to reduce financial risk—for example, lowering the leverage ratio in preparation for a recession.
Expected return: Low (equal to the after-tax interest rate on the debt, generally around 2–4% a year). The return on repaying debt is simply the interest saved, so as long as the ROIC of the core business exceeds that rate, investment takes priority over repayment. Theory since Modigliani & Miller (1958, 1963) holds that debt carries a tax shield and that the optimal level is set by weighing that benefit against bankruptcy costs. Graham (2000) estimated the tax-shield value of debt at roughly 9.7% of corporate value, while noting that large, high-quality companies in particular use far less debt than the theoretical optimum would suggest. If debt costs 3% after tax and the core business earns an ROIC of 15%, for example, repayment ranks low on the list of priorities.
Probability of success: High (the interest saving is certain—the least uncertain of all investment destinations). Note, however, that repayment is an investment that lowers the discount rate (risk), not one that raises profits. As we showed in an earlier article (mign, 2026a), for example, a company whose earnings have become more volatile because of rising fixed costs can protect its corporate value by reducing debt and thereby lowering the financial component of its discount rate.
Time horizon: Repayment can be carried out immediately, and its effects—lower interest payments and lower risk—appear immediately as well. If, for example, interest payments would exceed 30% of operating cash flow under a recession scenario, it is reasonable to set a condition that repayment takes priority over other investments.
Thinking in terms of an investment portfolio
Evaluating each investment destination from the previous chapter in isolation does not yield an optimal allocation overall. This chapter organizes the principles for thinking about investments in combination, from six perspectives: diversification, real options, alignment with strategy, the innovation portfolio, time horizons, and failure patterns.
Diversification
Diversification is fundamental to portfolio theory for investors, but it cannot be applied directly to operating companies. The reason is that shareholders can diversify on their own.
Shareholders can diversify themselves: Portfolio theory since Markowitz (1952) shows that combining assets with low correlation reduces risk, but shareholders can achieve this diversification cheaply in the market themselves. When an operating company diversifies by holding businesses or financial assets unrelated to its core operations, it creates no new value for shareholders. If a manufacturer uses surplus cash to buy an equity mutual fund, for example, corporate value does not rise, because shareholders could have bought the same fund on their own.
The diversification discount: Lang & Stulz (1994) showed that among US companies in the 1980s, the degree of diversification was consistently negatively related to Tobin's q, and Berger & Ofek (1995) found that diversified companies lost 13–15% of value on average compared with the sum of their business units valued as stand-alone companies. A company with several unrelated businesses, for example, would often command a higher combined market value if it were split into focused stand-alone companies.
The diversification premium: Campa & Kedia (2002) showed that once you control for self-selection—companies that were already lowly valued being the ones that choose to diversify—the discount shrinks or disappears, and Villalonga (2004) found that establishment-level data actually reveal a diversification premium. In markets with underdeveloped institutions, moreover, diversified business groups substitute for missing capital, labor, and information markets, and the affiliates of the most diversified groups outperform independent companies (Khanna & Palepu, 2000). The current understanding, in other words, is not that diversification destroys value but that there are value-destroying ways of diversifying.
Investment disparities between divisions: Stein (1997) argued that because headquarters, unlike a bank, holds control rights, it can create value through "winner-picking"—shifting funds from weak businesses to promising ones—but only across a small number of related businesses that headquarters can actually keep an eye on. Conversely, Scharfstein & Stein (2000) pointed out that rent-seeking by division heads produces "corporate socialism," in which strong divisions subsidize weak ones, and Rajan et al. (2000) demonstrated empirically that the wider the gap in investment opportunities between divisions, the more capital flows to inefficient divisions. In short, internal capital markets tend to work in companies with a few closely related businesses, and tend not to work in companies with many businesses whose investment opportunities are scattered.
Real options
For highly uncertain investments, the rational approach is not to make one large bet but to bet small in stages and expand as information comes in. This way of thinking is known as real options.
The value of waiting: McDonald & Siegel (1986) showed that for irreversible investments the "option to wait" has value, and that under reasonable parameters it can be optimal to wait until the benefits are roughly twice the investment outlay. Dixit & Pindyck (1994) systematized this insight, arguing that because carrying out an investment means giving up the option to wait, a positive NPV alone is not sufficient. The phenomenon of companies using hurdle rates above their theoretical cost of capital (Jagannathan et al., 2016), for example, can be partly explained by this option value.
Types of options: Trigeorgis (1996) catalogued options to defer, to invest in stages, to alter scale, to abandon, to switch, and to grow, and formalized the relationship as expanded NPV = static NPV + the value of options. If a factory is built in two phases rather than all at once, for example, the decision on the second phase can be made after observing first-phase demand—and that flexibility has value.
Strategy as a portfolio of options: Luehrman (1998) divided projects into six regions along two axes, the value-to-cost ratio and volatility, and offered the metaphor of a "tomato garden" to distinguish the projects that should be invested in now, those that should be discarded, and those that should be nurtured while waiting. A project with a negative NPV today but high uncertainty and real future potential, for example, becomes a candidate for a small investment to cultivate it.
Experiments in new businesses: Kerr et al. (2014) argued that because the probability of a new venture's success cannot be known before investing, a system that runs many cheap experiments is the rational choice, and noted that the cost of experimenting with starting a company fell over a decade from roughly $5 million to under $50,000. Collins & Hansen (2011) reported that companies that first calibrated their aim with low-cost, low-risk "bullets" before firing "cannonballs" backed by major resources achieved tenfold results in uncertain environments. In digital transformation investments too, for example, deciding the conditions for staged investment and withdrawal in advance makes it possible to rationally undertake projects that a static NPV would have rejected.
Alignment with strategy
Investment is the means by which strategy is executed. In a company without a settled strategy, the allocation of investment will lack coherence no matter how precisely it is calculated.
The strategy diamond: In the strategy diamond of Hambrick & Fredrickson (2001), a strategy consists of five elements: Arenas (where to compete), Vehicles (how to get there: build, partner, or buy), Differentiators (how to win), Staging (in what sequence and at what speed), and Economic Logic (how profits are generated). Choosing where to invest is nothing other than choosing Arenas and Vehicles. For example, an Arenas-and-Staging decision such as "enter an adjacent market within three years" gets translated into investment allocation through a Vehicles decision: build the new business in-house, form a partnership, or acquire.
Ally or acquire: Dyer et al. (2004) laid out decision criteria: if the resources you need are embodied in people, partner; if they are facilities or technology, acquire; and where market uncertainty is high, partner first and acquire once you are confident. For example, in a field where the direction of the technology is still unsettled, the right sequence is to learn through a minority stake or joint development and switch to an acquisition once a path to winning becomes clear.
Core, adjacent, and new territory: Zook & Allen (2003) showed that most companies that grow sustainably expand around their core business using a repeatable formula. They reported that moves into adjacent areas succeed about 25% of the time on average, but that companies with a repeatable expansion formula achieve twice that rate. For example, companies that keep taking "one step at a time" adjacencies, such as selling new products to the same customers or the same products in new regions, have a higher probability of success than those that leap straight into entirely new territory.
Big moves: Analyzing 2,393 of the world's largest companies, Bradley et al. (2018) showed that roughly 90% of economic profit is captured by the top quintile, and that a company in the middle has only about an 8% chance of moving into the top tier within ten years. What raised the odds of moving up were five "big moves": programmatic M&A, reallocating more than 60% of capital over a decade, a capital-expenditure ratio at least 1.7 times the industry median, productivity improvement, and differentiation. For example, nudging each division's budget up or down a little each year does nothing to change a company's strategic position.
The innovation portfolio
There are several practical rules of thumb for splitting investment between existing and new businesses. None of them is a "golden ratio"; all assume adjustment for industry and maturity.
70/20/10: Nagji & Tuff (2012) reported that high-performing companies allocate roughly 70% of their innovation investment to the core, 20% to adjacent areas, and 10% to transformational initiatives, and that the composition of returns is the reverse (core 10%, adjacent 20%, transformational 70%). For example, because transformational initiatives that account for just a tenth of the spend generate seven-tenths of long-term returns, it is essential never to let even that small allocation lapse.
The three horizons: Baghai et al. (1999) presented a framework for simultaneously managing the defense and extension of today's core business (Horizon 1), emerging new businesses (Horizon 2), and the seeding of future options (Horizon 3). For example, the better Horizon 1 profits are, the more discipline it takes to maintain allocations to Horizons 2 and 3.
Ambidexterity: O'Reilly & Tushman (2008) theorized the ability to pursue exploitation of existing businesses and exploration of new areas at the same time as a "dynamic capability," and recommend structurally separating exploration units while integrating them at the senior-management level. For example, if an exploration unit is held to the same margin targets and KPIs as the existing business, exploration shrinks in short order.
Discovery-driven planning: McGrath & MacMillan (2009) described an approach for new ventures in which, rather than trusting the business plan, you list the "assumptions that must hold" and release funding in stages at checkpoints, testing the cheapest-to-verify assumptions first. For example, you would validate the assumption "customers will pay 10,000 yen a month" through interviews with ten companies before investing in product development.
Aligning time horizons
When the payback period of an investment is out of step with the time horizons of capital providers and executives, sensible investments get shelved and unsound ones keep going.
The productivity J-curve: Brynjolfsson et al. (2021) showed a "J-curve" in which, during the early adoption of a general-purpose technology, complementary intangible investments go unmeasured and productivity is understated, only to be overstated later. For example, if the payoff from AI investment is judged solely on first-year profit and loss, almost every project looks like a "failure."
Short-termism: Fried & Wang (2019) tested the claim that shareholder payouts have crowded out investment and concluded that net payouts amounted to 41% of net income while both investment and cash holdings were increasing. On the other hand, Almeida et al. (2016) showed that quarterly EPS targets do in fact trigger cuts to investment. For example, short-termism is better understood not as a company-wide tendency but as a behavior that surfaces in specific situations, namely when a company looks set to miss its earnings guidance by a small margin.
Long-term performance metrics: Bezos (1998) declared that Amazon would "make investment decisions in light of long-term market leadership considerations rather than short-term profitability considerations or short-term Wall Street reactions," and Bezos (2017) stated that most decisions should be made with about 70% of the information you wish you had. For example, an investment that takes five or more years to pay back will be cut off midway unless there is a mechanism to measure progress through intermediate KPIs (customer counts, usage rates, accumulation of intangible assets).
Failure patterns in capital allocation
Knowing the failure patterns that research has confirmed again and again is a prerequisite for designing any framework.
Repeating last year: The correlation between one year's capital allocation and the previous year's averages 0.92 (Hall et al., 2012), and Birshan et al. (2013) report that "resource inertia," where each unit's allocation matches the prior year, often exceeds 90%. For example, in companies where the budget meeting is a forum for debating "what percentage up or down from last year," reallocation structurally never happens.
Empire building and overconfidence: The overinvestment of surplus cash flow discussed by Jensen (1986) is amplified by CEO overconfidence. Malmendier & Tate (2005) showed that "overconfident" CEOs, those who hold their own company's stock options all the way to expiry, overinvest when cash is on hand, and Malmendier & Tate (2008) showed that the same type of CEO is 65% more likely to make acquisitions. For example, the more cash-rich a company is, the more it needs a mechanism for bringing outside perspectives into investment decisions.
Sunk costs and escalation of commitment: Staw (1976) demonstrated experimentally that when an investment people chose themselves fails, they tend to pour additional funds into that very project, and Arkes & Blumer (1985) showed that money already spent distorts judgment even though it is rationally irrelevant. For example, the decision on whether to continue a new business that has absorbed a cumulative 10 billion yen should be based not on "the 10 billion yen so far" but solely on the funds yet to be invested and the cash flows yet to be earned.
The planning fallacy: Lovallo & Kahneman (2003) argued that executives tend to build optimistic plans from an "inside view" and should correct them with an "outside view" based on the actual distribution of outcomes for similar projects. In the data of Flyvbjerg & Gardner (2023) covering more than 16,000 projects, 91.5% overran their budget or schedule, and only 0.5% delivered on budget, schedule, and benefits alike. For example, 18% of IT projects run more than 50% over cost, and among those the average overrun reaches 447%.
Excessive risk aversion: Lovallo et al. (2020) pointed out that because middle managers "bet their careers" on each individual project, their loss aversion is strong, they demand the same rigor for small investments as for large ones, and the company as a whole ends up excessively risk-averse. For example, if a 10-million-yen experimental investment is subject to the same approval criteria as a 1-billion-yen capital expenditure, the small bets that should be taken are systematically weeded out.
The ideal portfolio by company stage, size, and line of business
There is no single ideal investment portfolio; it changes with a company's stage, size, and line of business. This chapter combines the research figures and principles from the preceding chapters to lay out how allocation shifts under each set of conditions. The allocation ratios in this chapter are not values established by research but guidelines derived from the studies and principles cited.
By stage
A company's stage simultaneously determines the distribution of investment opportunities, its access to capital, and its tolerance for failure, which makes it the single biggest influence on allocation.
Founding stage (around product-market fit): At this stage the optimal allocation is nearly 100% to the core business. Because the probability of startup success is low and the distribution is extremely skewed (Kerr et al., 2014), the only source of return for a founding-stage company is the success of its main business, and diversification is meaningless. Hall & Woodward (2010) showed that roughly three-quarters of VC-backed entrepreneurs receive nothing at exit; undiversifiable risk is already being taken to the fullest. Financial assets should serve only as tools for managing cash flow, held in deposits, government money market funds, and short-term government bonds, with deposits spread across banks, as 45% of corporate treasurers did after the 2023 US bank failures (Association for Financial Professionals, 2024). For example, putting part of the capital raised into listed equities, or diverting it to a new business unrelated to the core, runs counter to the purpose for which investors entrusted the money.
Growth stage (once the business model has become repeatable): Keep investment centered on the core business (roughly 75–85% as a guideline), adding expansion into adjacent areas (10–20%) and small-scale experiments (around 5%). As Zook & Allen (2003) show, expansion into adjacent areas succeeds about 25% of the time on average, but twice that for companies with a repeatable formula, so repeating small moves of the same type has a higher expected value than a single large leap. One rule of thumb measures the balance between growth and profitability as "growth rate plus free cash flow margin," with benchmarks for software companies of around 70% at $25–50 million ARR and around 50% above $100 million (Bessemer Venture Partners, 2021). For example, attempting a first small acquisition (a tuck-in) at this stage and beginning to build integration capability within the organization is what lays the groundwork for programmatic M&A later on.
Listed and mid-sized companies: Take the 70/20/10 split of Nagji & Tuff (2012) as a starting point, targeting roughly 70% core, 20% adjacent, and 10% transformational, and shift M&A toward a programmatic model of several small and mid-sized deals every year (Daume et al., 2021). According to Bradley et al. (2018), programmatic acquirers put around 5–6% of their market capitalization into acquisitions annually, compared with 2–3% for the average company. Businesses whose ROIC persistently falls below the cost of capital become divestiture candidates, with the proceeds either reallocated or returned to shareholders. For example, a company with a core business earning 20% ROIC and a peripheral business earning 5% ROIC with no prospect of improvement would be worth more if it sold the peripheral business and invested in areas adjacent to its core.
Mature and large companies: Because investment opportunities become scarce relative to available capital, the share of capital returned to shareholders rises. In the US, buybacks have reached 1.3 times the level of dividends (Mauboussin & Callahan, 2025), and total shareholder returns across the S&P 500 came to $1.57 trillion in 2024 (S&P Dow Jones Indices, 2025). At the same time, larger companies can hold many more bets simultaneously, so the absolute amount devoted to CVC and transformational investment can be larger. Making divestiture a routine activity—such as the rule cited by Birshan et al. (2013) of selling 2–3% of the portfolio every year—generates the funds for reallocation. Alphabet, for instance, used its 2015 conversion to a holding-company structure to combine focus on the core business with separate management of its speculative ventures (Other Bets), declaring that it would be "rigorous about capital allocation" (Page, 2015).
By company size
Size determines both the number of bets a company can make and the size of each one. Small companies have no choice but to concentrate; large companies can think in terms of distributions.
Small companies must concentrate: A company that can place only a few bets cannot count on earning the average return from new ventures or acquisitions, whose payoffs are heavily skewed. The distribution reported by Kerr et al. (2014)—55% of investments lose money, while 6% generate half of total returns—means that a company able to make only one or two bets will most likely end up with a loss. For example, a company with ¥500 million of annual investment capacity is better off, in expected-value terms, splitting that money between improvements to its existing business with a high probability of success and experiments costing tens of millions of yen each, rather than putting the full ¥500 million into a new venture with a 25% chance of success.
Large companies can think in distributions: According to McKinsey & Company (2020), companies that launched four or more new businesses in the past decade were more than twice as likely to earn returns of five times or more on their investment, and roughly two-thirds of large new businesses came from companies that had built multiple businesses. Booking.com, cited by Thomke (2020), runs about 25,000 experiments a year, and Koning et al. (2022) showed that startups that adopt A/B testing see higher growth metrics and more new product launches. For example, with the same ¥10 billion, splitting it across ten small acquisitions and twenty experiments beats putting it all into one large acquisition—both in terms of learning and in terms of expected value.
Bigger acquisitions fail more often: Moeller et al. (2004) examined 12,023 US acquisitions between 1980 and 2001 and found that shareholders of small acquirers gained a combined $8 billion, while shareholders of large acquirers lost $226 billion. The larger a company becomes, the larger an acquisition has to be to matter, and the larger the losses when it fails—which is precisely why large companies should make a steady accumulation of small deals their default approach.
The right level of cash depends on size: Opler et al. (1999) showed that companies with greater growth opportunities and more volatile cash flows hold higher cash ratios, while large companies with good access to capital markets hold lower ones. Begenau & Palazzo (2021) find that the rise in cash ratios among US listed companies can be explained by the entry of R&D-intensive, thin-margin newly listed firms. For a young, research-driven company, holding several years' worth of revenue in cash is rational; for a stable large company, holding cash at the same ratio amounts to a lack of discipline in the sense of Jensen (1986).
By type of business
The nature of the business changes both the mix of investment targets and the time horizon of returns. Here we sort businesses into four types.
Capital-intensive (manufacturing, infrastructure, energy): Capital expenditure is the largest use of funds, and net capex as a share of revenue exceeds 30–40% in utilities (Damodaran, 2026). Because investments are irreversible and large, this is the type of business where real options—staged investment and deferral—carry the greatest value (Dixit & Pindyck, 1994). For example, a design that defers phase-two capital expenditure until demand is confirmed is most effective for companies of this type.
Asset-light (software, AI, services): Investment goes mainly into intangibles—R&D, talent, customer acquisition, data. Even across US companies as a whole, intangible investment stands at 13.4% of revenue, more than double capital expenditure (6.3%) (Mauboussin & Callahan, 2025). Because intangibles are scalable and sunk (Haskel & Westlake, 2017), returns on success are enormous, while recovery after failure is almost impossible. For companies of this type, the allocation criteria are not "capex amount" but metrics such as the ratio of customer acquisition cost to customer lifetime value, or output measures for R&D.
Regulated industries (finance, healthcare, utilities, construction): Regulation determines whether and when investments can be made, and because entry barriers are high, ROIC in existing businesses tends to be stable. Regulatory change is one of the main sources of new growth markets, so investments that read the direction of regulation through scenarios and monitor leading indicators are effective. For example, systems investment for regulatory compliance should sensibly be treated under a separate budget as "efficiency investment" that does not create competitive advantage.
Platform businesses (businesses with network effects): Early customer-acquisition investment is heavy and monetization only begins once scale crosses a threshold, making this the type with the deepest J-curve. Bezos's (2016) view that a bet with a 10% chance of a 100-fold return should always be taken captures the decision-making logic of this type of business. In its 1997 letter to shareholders, Amazon declared that it would make investment decisions in light of long-term market leadership rather than short-term profitability, and it went on to launch Prime, AWS, and Marketplace each as bold bets (Bezos, 1998; Bezos, 2015).
A framework for evaluating investment options
This chapter brings the preceding discussion together into a single process. The question is simple: when a company has resources, in what order and in what proportions should it deploy them to maximize enterprise value? The answer can be broken into eight steps.
Step 1: Define the objective function and the unit of allocation
The first decisions are what to maximize and what unit to allocate across. If these are left vague while individual projects are evaluated, capital flows to whichever division shouts loudest.
Make enterprise value the objective function: Enterprise value is the discounted present value of future free cash flows, and the levers that move it are three: profit, risk, and growth (Koller et al., 2020). Making any one of revenue, market share, or profit the objective justifies investments that sacrifice the other levers. If revenue is the goal, low-ROIC acquisitions look "rational"; if current-period profit is the goal, cutting R&D and marketing does.
Define the unit of allocation: The unit of allocation should be the "strategic unit" (market × product × customer segment), not the business division. Hall et al. (2012) note that the coarser the allocation unit, the more likely it is that last year's budget is simply carried over, and Birshan et al. (2013) list building a fine-grained "resource map" as the first technique. For example, splitting "the manufacturing division" into "core product, existing customers," "core product, new regions," and "new products" reveals wide differences in ROIC within the same division.
Define the cycle: Separate the annual allocation from quarterly reviews. Birshan et al. (2013) recommend holding strategy discussions and budget discussions at different times of year and keeping a pool that the CEO can deploy at their discretion (5% of capex at one company). In practice, this means fixing the allocation at the start of the year and then revisiting, each quarter, only those projects that have hit an exit trigger or met the conditions for additional investment.
Define who decides: As Stein (1997) shows, internal capital markets work when headquarters can oversee a small number of related businesses. If the final allocation decision is left to a council of division heads, the "socialism" within the firm described by Scharfstein & Stein (2000) sets in, and capital flows from strong businesses to weak ones.
Step 2: Take stock of resources and constraints
Next, count the resources available for allocation and the constraints that must not be crossed. Forgetting to count resources other than cash at this stage leads to allocations that exceed the company's capacity to execute.
Calculate the investable amount: Add up operating cash flow, surplus cash (cash on hand minus the required cash level), borrowing capacity, and capital recoverable through divestitures. More than 90% of US corporate funding comes from internal sources (Mauboussin & Callahan, 2014), so the starting point is an estimate of internally generated capital. For example, with ¥12 billion of operating cash flow, ¥5 billion of surplus cash, ¥20 billion of borrowing capacity, and ¥9 billion expected from divestiture candidates, the ceiling on investable funds is ¥46 billion, from which the amount to deploy this period is decided.
Set the required cash level: Decide up front the level that keeps liquidity safe, and never go below it. As Opler et al. (1999) and Bates et al. (2009) show, the required level is higher for companies with more volatile cash flows and more R&D-intensive operations. For example, set aside six months of fixed costs, or 18 months of runway until the next funding round, as "untouchable cash."
Count talent and management time: As Jagannathan et al. (2016) show, the real constraint on companies is not money but managerial talent and execution capacity. Integrating an acquisition, launching a new business, and building a large facility each require people capable of leading them. Put numerical ceilings on execution capacity—for instance, no more than two acquisition integrations and one new-business launch running at the same time.
Set the risk tolerance: Decide the maximum loss that would not threaten the continuity of the business. As Lovallo et al. (2020) point out, this judgment should be made at the level of the whole company rather than project by project, with a lenient stance toward small bets and a strict one toward large bets. For example, express tolerance as two conditions: the maximum loss on any single project is capped at 10% of investable funds, and even a run of failures must not breach the required cash level.
Step 3: List investment opportunities exhaustively
If the list of opportunities has gaps, the results will be skewed no matter how precise the subsequent calculations. Include all five destinations plus "waiting," and run a first screen against the strategy.
Generate candidates across all five destinations: List candidates in every category—existing businesses (plant and equipment, R&D, sales, people, IT, intangibles, working capital), new businesses, M&A and alliances (including divestitures), financial assets, and shareholder returns and debt repayment—and make "waiting" an explicit option as well. Mauboussin & Callahan (2025) set out two principles here: allocate from a zero base, and fund strategies rather than projects. A company that leaves "divest a business" and "buy back shares" off its list, for instance, has implicitly decided to keep every business running and deploy all of its capital internally.
Run a first screen against strategy: Using the strategy diamond of Hambrick & Fredrickson (2001), drop any candidate that does not align with the chosen Arenas (where to compete) and Vehicles (how to get there). This is also where you apply the "ally or acquire" criteria of Dyer et al. (2004) to decide which form—alliance, equity stake, or acquisition—is appropriate. If the strategy is to enter an adjacent market within three years, for example, an acquisition target in an unrelated market is removed from consideration no matter how cheap it looks.
Classify by relationship to competitive advantage: As in a VRIO screen, separate the candidates that strengthen a sustainable competitive advantage from the efficiency investments that merely maintain competitive parity. Treating regulatory compliance or core-system upgrades as efficiency investments in their own separate bucket, for example, keeps them from competing head-to-head with advantage-building investments—and prevents necessary efficiency spending from being cut.
Supplement the list with an outside view: Birshan et al. (2013) describe a consumer goods company that widened its allocation debate from 90–110% of the prior year's figures to 50–200% by bringing externally sourced "counter-anchors" into the discussion. Compare your own allocation with competitors' and with industry capital expenditure ratios (Damodaran, 2026), for example, and add "areas where we are not investing" to the candidate list.
Step 4: Estimate each opportunity
For each opportunity, estimate the expected return, probability of success, dispersion, time horizon, resources required, strategic value, and option value. The starting point for these estimates is research and industry base rates, not the company's own hopes.
Start from base rates: As Lovallo & Kahneman (2003) and Flyvbjerg (2006) show, plans built solely from the inside view skew optimistic. Use the research figures compiled in Chapter 2—a 24% rate of new ventures reaching scale, a 25% success rate for adjacency moves, average acquirer returns of roughly zero, 65% of VC investments losing principal, and so on—as base rates, then adjust for your own circumstances. If a new-venture plan assumes an 80% probability of success, for example, demand evidence that explains the gap from the 25% base rate: the company's own track record, or the existence of a repeatable playbook.
Express growth-market assumptions as probabilities: For investments premised on market growth, follow the approach laid out in our earlier article (mign, 2026d): use a different forecasting method for each source of growth (political, economic, social, technological), break the question into smaller parts, start from base rates, and update the probabilities as new information arrives. Rather than "this market will triple in five years," for example, decompose it: "60% probability that technology costs fall below the threshold, 50% probability that the regulatory framework is in place, and if both happen, the market triples."
Estimate distributions, not just expected values: Estimate three things: the return multiple on success, the loss rate on failure, and the probability of success. As Kerr et al. (2014) and Bessembinder (2018) show, returns on new ventures and on stocks are heavily skewed toward a handful of big winners, so the average says almost nothing about the outcome of most projects. A project described as "20% chance of success, 5x the investment on success, total loss on failure" has an expected value of 1.0x the investment (= 0.2 × 5)—an expected return of zero—but the distribution reveals that only one in five will pay off.
Set the time horizon and interim metrics: Decide the payback period and the interim KPIs for measuring progress along the way. As the J-curve of Brynjolfsson et al. (2021) shows, investments involving intangibles depress profits early on, so without metrics other than profit and loss, the right investments get cut midway. For AI investments, for example, use "automation rate for the target process" and "number of exceptions handled" as interim KPIs; for new businesses, "number of paying customers" and "retention rate."
Estimate option value: For projects that can be funded in stages, assess how much the information gained in stage one improves the decision at stage two (Luehrman, 1998; Trigeorgis, 1996). If a ¥100 million pilot reveals whether demand exists and reduces the probability of failure for a ¥1 billion full-scale investment from 50% to 20%, for example, the pilot is worth the equivalent of ¥1 billion × 30% = ¥300 million.
Step 5: Accept or reject against hurdle rates
Compare each estimated opportunity against the hurdle rate for its category and decide whether to accept it. Existing businesses rejected at this stage become divestiture candidates.
Set hurdle rates by category: Use a level close to WACC for the core business, somewhat higher for adjacencies, and higher still for new businesses. Jagannathan et al. (2016) show that hurdle rates in practice run about twice the cost of capital, but the reason was constraints on execution capacity and option value, not a shortage of funds. As a rule of thumb, this article uses WACC + 0–2 points for core, WACC + 3–5 points for adjacencies, WACC + 10–15 points for new businesses, and the market return for financial assets. For a company with a WACC of 8%, for example, that means 8–10% for core, 11–13% for adjacencies, and 18–23% for new businesses.
Don't set hurdle rates too high: Gormsen & Huber (2025) show that corporate discount rates average about 3 points above the cost of capital, and that this gap explains the underinvestment of recent years. Mark Leonard, founder of Constellation Software, observed that "hurdle rates act like magnets: once you lower one, the expected returns on subsequent deals get pulled toward the new level" (Leonard, 2016)—but the reverse is also true: a hurdle rate set too high passes up projects that clear the cost of capital and destroys enterprise value. A company that applies a flat 15% hurdle rate even to its core business, for example, will pass on an equipment upgrade with a 12% ROIC that would reliably create value.
Decide with NPV and PI: Check that each project's NPV is positive, and under capital constraints rank projects by profitability index (PI = NPV ÷ investment), highest first (Brealey et al., 2022; mign, 2026a). For two projects with the same NPV of ¥1 billion, for example, the one requiring ¥2 billion of investment (PI 0.5) takes priority over the one requiring ¥5 billion (PI 0.2).
Move rejected existing businesses to the divestiture list: Reject continued investment in businesses whose ROIC is below the cost of capital with no prospect of improvement, and move them to the list of candidates for sale or downsizing. As Mulherin & Boone (2000) and Lee & Madhavan (2010) show, divestitures raise shareholder value on average. A peripheral business earning a 4% ROIC, for example, adds more to enterprise value if it is sold and the proceeds redeployed into a core business earning 18% ROIC than if investment in it continues.
Step 6: Construct the portfolio
Assemble the accepted candidates into a single portfolio. Simply ranking projects by individual NPV leads to one of two outcomes—either new businesses get nothing, or the portfolio exceeds execution capacity—so adjust using an allocation formula and caps.
The allocation formula: Compute each candidate's weight as "expected excess return × strategic fit ÷ risk," then normalize to the investable amount subject to the constraints. Expected excess return is the expected return minus the category hurdle rate; strategic fit is alignment with the strategy diamond scored on a three-point scale; and risk is dispersion and the loss rate on failure, also on a three-point scale. A project with 10 points of expected excess return, a fit of 3, and a risk of 1 (weight 30), for example, gets roughly nine times the priority of a project with 5 points of excess return, a fit of 2, and a risk of 3 (weight 3.3).
Set cap ratios: Use the stage-based guidelines (near 100% core in the founding stage; 75–85% core in the growth stage; 70/20/10 for listed and mid-sized companies; 60–70/15–20/10–15 at maturity) as upper and lower bounds, and adjust so the formula's output falls within these ranges. The "10% transformational" of Nagji & Tuff (2012) acts as a floor, ensuring that exploratory investment continues even in years when short-term profits are strong. Even in a year when the formula assigns zero to transformational investment, for example, the 10% floor goes to "bullet" experiments.
Use the Kelly criterion to cap any single bet: For bets where the probability of success p and the net return multiple on success b can be estimated, use the Kelly (1956) criterion f = p − (1 − p) ÷ b to set a per-project cap as a share of investable capital. To hedge against estimation error, practitioners widely use half that amount (half-Kelly) (MacLean et al., 2011). For a project with a 20% probability of success and a 5x payoff (net return 4x), for example, f = 0.2 − 0.8 ÷ 4 = 0: the expected value is zero, so no investment. With a 10x payoff (net return 9x), f = 0.2 − 0.8 ÷ 9 ≈ 0.11, and under half-Kelly the cap for a single project is roughly 5.5% of investable capital.
Stage investments with real options: For highly uncertain projects, do not allocate the full amount at once; set a stage-one budget and the conditions for proceeding to stage two (Dixit & Pindyck, 1994; McGrath & MacMillan, 2009). As Adner & Levinthal (2004) warn, options do not work unless the abandonment conditions are set at the outset. Put it in writing, for example: "If the project reaches 30 paying customers and 80% retention within 12 months, allocate the ¥500 million for stage two; otherwise, terminate."
Check correlation and execution capacity: Verify that the proposed allocation is not concentrated in projects that depend on the same factor (the business cycle of the same customer industry, the same technology, the same regulation), and that it does not exceed the number of projects the organization can execute at once (Step 2). If three acquisitions and two new businesses all assume growth in the same customer industry, for example, a single failure factor hits all five.
Step 7: Handle residual capital
If capital remains after every accepted internal candidate has been funded, decide the order in which to deploy it. This article's position is: hold → return to shareholders → repay debt. When financial safety is inadequate, however, debt repayment comes first.
Estimate the value of waiting: When the next investment opportunity is likely in the near future, there is value in parking capital in short-term government bonds or government money market funds (McDonald & Siegel, 1986). As Buffett (2025) put it, "often, nothing looks compelling; very infrequently we find ourselves knee-deep in opportunities"—waiting is a rational choice when opportunities are unevenly distributed over time. If industry consolidation is expected and acquisition opportunities are likely to cluster within two years, for example, holding ample cash is not "not investing" but "preparing to acquire."
Set a ceiling on capital held in reserve: That said, the marginal value of a dollar of cash is less than a dollar, and it falls further the weaker a company's governance is (Faulkender & Wang, 2006; Dittmar & Mahrt-Smith, 2007). Any capital kept on standby should come with three labels: what it is for, how long it will be held, and the ceiling above which it is returned to shareholders. For example: "Cash in excess of the required cash level plus two years of planned investment is returned through buybacks or dividends in the following period."
Choose the form of shareholder returns based on the share price: If the stock is trading below enterprise value, buybacks are the rational choice; if it is trading above, dividends are (Buffett, 2024; Mauboussin & Callahan, 2025). Because dividends are hard to cut once started and can squeeze investment (Brav et al., 2005), companies with volatile earnings should rely mainly on buybacks. Buybacks carried out to hit EPS targets (Almeida et al., 2016) should be avoided, since they tend to come at the expense of investment.
Treat debt repayment as an investment that lowers the discount rate: The return on repaying debt equals the after-tax interest rate on borrowing, so as long as the core business's ROIC exceeds that rate, repayment is a low priority. However, for companies whose earnings have become more volatile because of rising fixed costs or economic swings, the reduction in the discount rate that repayment brings protects enterprise value (Graham, 2000; mign, 2026a). For example, if the after-tax cost of debt is 3% and the core business earns an ROIC of 15%, repayment can wait; but if the capital structure means interest payments would exceed half of operating cash flow in a downturn, repayment comes first.
Do not hold financial assets unrelated to the core business: Pure investments in listed equities, real estate, or crypto assets do not add to enterprise value, because shareholders can make those investments themselves, and they amplify the volatility of the core business's earnings. Even holdings justified on "strategic" grounds, such as cross-shareholdings, should be sold and the proceeds redeployed unless they are tied to genuine business cooperation such as a partnership or joint investment (Allen & Phillips, 2000).
Step 8: Execute, monitor, and reallocate
The real work begins after the allocation is decided. Track progress against interim KPIs, halt projects that trip their exit criteria, and reallocate in the next cycle. This is also where you build in the mechanisms that prevent year-over-year carryover and escalation of commitment.
Monitor with interim KPIs: Track the interim KPIs set in Step 4 separately from the P&L. A useful approach is to measure usage, satisfaction, and net benefit at three points: before adoption, immediately after, and once the initiative has bedded in. For an AI investment, for example, evaluate the utilization rate at three months and the net benefit at twelve months, and judge the impact on the P&L at twenty-four months.
Apply exit criteria mechanically: To prevent the escalation of commitment documented by Staw (1976) and Arkes & Blumer (1985), separate the exit decision from the project's sponsor and make it according to criteria set in advance. For example, adopt a rule such as "if an interim KPI falls below 70% of target for two consecutive periods, the project is automatically put under review," and keep the amount already invested off the table in that review.
Design the reallocation meeting: Birshan et al. (2013) recommend designing the budget meeting as a forum for reallocation rather than year-over-year comparison, requiring each participant to state explicitly what they are betting on, and keeping a record of the discussion for later review. Use the rate of change in the allocation itself as a metric, as in the case of a natural resources company that reallocated 30% of its capital expenditure in the first year of a new CEO's tenure.
Use retrospectives to sharpen estimates: As Flyvbjerg & Gardner (2023) show, the gap between plan and outcome is systematically biased. Record the estimates made at approval (expected return, probability of success, and timeline) alongside actual results, and feed the observed bias into the base rates used in the next cycle. For example, if new ventures over the past five years were planned with an average 70% probability of success but only 20% actually succeeded, discount every planned success probability in the next cycle accordingly.
Ask the "big move" question on a regular schedule: Simply running the annual cycle will not produce the upward mobility that Bradley et al. (2018) describe. Every three to five years, separately from the normal cycle, consider whether a strategic reallocation on the scale of moving 60% or more of capital over a decade is warranted. If the market for the main business is in structural decline, for example, the discussion should be about divestiture and large-scale reallocation head-on, not about annual fine-tuning.
Case studies
Here we apply the same procedure to two companies: an AI startup with ¥1 billion in revenue and a listed company with ¥100 billion in revenue. All figures are hypothetical and are intended only to illustrate how the procedure is used.
Company A: an AI startup with ¥1 billion in revenue
Steps 1–2: The objective function is enterprise value (the valuation at the next funding round). The company has ¥1.5 billion in cash on hand and annual operating cash flow of −¥200 million. Setting the required cash level at eighteen months of working capital, or ¥900 million, leaves ¥700 million of investable capital for the current period. The execution constraint is that no more than two new initiatives can run at the same time.
Steps 3–4: The candidates are: (1) development and sales headcount for the flagship product (¥400 million, expected return 30%, probability of success 80%); (2) features for an adjacent segment (¥200 million, 25%, 50%); (3) an experiment with a new product (¥100 million, probability of success 20%, 10× payoff on success); (4) a minority stake in a peer startup (¥100 million, 15%); and (5) short-term government bonds (4%). WACC is set at 15%.
Step 5: The hurdle rates are 15% for core, 19% for adjacent, 27% for new ventures, and 4% for financial assets. Option (1) clears its hurdle by 15 points and option (2) by 6 points; option (3) is evaluated on its distribution of outcomes; option (4) falls 12 points short and is rejected; and option (5) is used only for capital held in reserve.
Step 6: The allocation formula gives option (1) a weight of 15 × 3 ÷ 1 = 45 and option (2) a weight of 6 × 2 ÷ 2 = 6. For option (3), the ceiling is set using the Kelly criterion rather than excess return: f = 0.2 − 0.8 ÷ 9 ≈ 0.11, and at half-Kelly that caps a single bet at roughly 5.5% of the ¥1.5 billion of investable capital, or about ¥80 million. The resulting allocation is ¥400 million to (1), ¥200 million to (2), ¥100 million to (3) (split into two experiments of ¥50 million each), and nothing to (4), for a total of ¥700 million.
Steps 7–8: All remaining cash is parked in government money market funds and short-term government bonds, with deposits spread across several banks. Option (2) advances to its second stage only if it reaches "20 paying customers within 12 months," and option (3) receives follow-on investment only for the one experiment that meets "10 customers in continued use within 6 months."
Company B: a listed company with ¥100 billion in revenue
Steps 1–2: The objective function is enterprise value (the present value of future free cash flow). With operating cash flow of ¥12 billion, surplus cash of ¥5 billion, borrowing capacity of ¥20 billion, and a WACC of 8%, investable capital for the current period is set at ¥15 billion. The company can integrate no more than two acquisitions at once and launch no more than one new business.
Steps 3–4: The candidates are: (1) equipment renewal and automation in the core business (¥8 billion, expected ROIC 18%); (2) development of adjacent products (¥3 billion, 14%); (3) two small acquisitions (¥4 billion combined, 15%); (4) a large acquisition of a competitor (¥30 billion, 10%); (5) new ventures and corporate venture capital (¥1.5 billion, expected return 25%, probability of success 30%); (6) continued investment in a peripheral business (¥2 billion, ROIC 4%); (7) cross-shareholdings (book value ¥3 billion, dividend yield 3%); and (8) share buybacks (the stock trades at 0.8× estimated enterprise value).
Step 5: The hurdle rates are 8% for core, 12% for adjacent, and 20% for new ventures. Option (1) clears its hurdle by 10 points, (2) by 2 points, and (3) by 3 points. Option (4) falls 2 points short and is rejected (it also exceeds both the investable capital and the integration capacity). Option (5) clears by 5 points. Option (6) falls 4 points short and is rejected, and the peripheral business is moved to the divestiture list (expected proceeds ¥6 billion). Option (7) involves no business cooperation, so the cross-shareholdings also go on the divestiture list (¥3 billion).
Step 6: The weights are 10 × 3 ÷ 1 = 30 for option (1), 2 × 3 ÷ 2 = 3 for (2), 3 × 3 ÷ 2 = 4.5 for (3), and 5 × 2 ÷ 3 ≈ 3.3 for (5). Of the ¥24 billion available (¥15 billion of investable capital plus ¥9 billion in divestiture proceeds), ¥16.5 billion is allocated: ¥8 billion to (1), ¥3 billion to (2), ¥4 billion to (3), and ¥1.5 billion to (5). Option (5) stays within the cap for transformational bets (10%) and is split into a first stage of ¥500 million and a second stage of ¥1 billion, with the conditions for advancing to the second stage documented.
Steps 7–8: The remaining ¥7.5 billion goes to share buybacks, since the stock is trading below estimated enterprise value. Because the after-tax cost of debt is 3%, well below the core business's ROIC of 18%, debt repayment is deferred, but with a condition attached: repayment takes priority if, under a recession scenario, interest payments would exceed 30% of operating cash flow. Interim KPIs and exit criteria are set for options (1) through (5), and at the following year's reallocation meeting the gap between estimates and actuals is used to correct the base rates.
Limits of the framework
This procedure structures the allocation debate, but it cannot produce answers better than the quality of its inputs. It should be used with its limitations clearly in mind.
Estimation error: Estimates of expected returns and success probabilities are systematically biased toward optimism (Lovallo & Kahneman, 2003; Flyvbjerg & Gardner, 2023). The allocation formula passes that error straight through to the result, so correction via base rates and retrospectives is essential. Overestimating the probability of success by just 10 points, for example, can be enough to either justify or reject an allocation to a new venture.
Quantifying strategic value: Expressing strategic fit on a three-point scale is only a rough approximation of strategic value (future options, competitive position, learning). Investments that protect cash flow rather than increase it, such as those made to block a competitor's entry, carry value that NPV struggles to capture.
Correlation and interaction: Correlations between projects (dependence on the same underlying factor) and interactions (where one project's success raises the value of another) do not show up in project-by-project estimates. As the Markowitz (1952) framework makes clear, the value of a portfolio is not the sum of its individual expected values. If two new ventures share the same customer base, for example, success in one lowers the customer acquisition cost of the other.
Organizational execution capacity: Even a correct allocation will not deliver results without the capacity to integrate, launch, and operate. As Jagannathan et al. (2016) show, the binding constraint in practice is execution capacity rather than funding. A policy of making five small acquisitions a year, for example, will not work unless the people who will handle integration have been developed first.
The formula is no substitute for debate: The role of the allocation formula is to make the premises of the discussion explicit (expected return, probability, fit, risk) so that capital is allocated on evidence rather than on last year's budget or on whoever argues loudest. When the formula's output and management's intuition diverge, that is precisely the moment when it is worth debating which input is wrong.
Recent research and practitioner trends
This chapter summarizes research from the 2020s together with the positions taken by prominent practitioners and companies. The research concentrates on how capital allocation actually works in practice, the returns on intangible assets and AI investment, and the reassessment of M&A and shareholder returns. Practitioners, meanwhile, are divided on three questions: concentrate or diversify, return capital or reinvest it, and whether AI investment has gone too far.
Recent research
Corporate discount rates have drifted away from the cost of capital, producing underinvestment: Gormsen & Huber (2025) compiled statements from the earnings calls of roughly 2,500 companies across 20 countries and found that the discount rates firms apply run about 3 percentage points above their own perceived cost of capital on average; in the United States, this wedge widened from about 3 points in 2002 to about 5 points in 2020. Changes in the cost of capital barely show up in discount rates within two years, and full pass-through takes more than a decade. Consider the "missing investment" of the low-rate 2010s, when capital spending failed to rise: under standard models it amounts to 20% of the US capital stock, but once the wedge is taken into account it all but disappears.
The cost of capital that companies perceive diverges from market reality, leading to capital misallocation: Gormsen & Huber (2024) found that differences across firms in their perceived cost of capital are barely explained by market-based expected returns, and that companies with higher perceived costs invest less and post higher ROIC. Take two companies in the same industry with the same risk profile: if one management team believes "our cost of capital is 12%" and the other believes "8%," their investment levels and capital efficiency will diverge over the long run.
Most of the "investment gap" can be explained by intangibles: Crouzet & Eberly (2023) decomposed the phenomenon of tangible investment lagging behind firm value into three components—rents on physical capital, intangible assets, and rents on intangibles—and showed that, once organizational capital is included, intangible-related factors account for about 69% of the gap. This is why capital expenditure at software and healthcare companies can look "low": much of their investment simply never appears on the balance sheet.
Much of the rise in corporate cash holdings is explained by a shift in the mix toward the kinds of companies that hold a lot of cash: The average cash-to-assets ratio of US listed companies doubled from 10.5% in 1980 to 23.2% in 2006 (Bates et al., 2009), but Begenau & Palazzo (2021) showed that most of this increase is explained by not-yet-profitable, R&D-intensive companies going public with high cash ratios and pulling up the average.
Share buybacks have nothing to do with underinvestment: Guest et al. (2023) sorted thousands of US companies by buyback intensity and found that repurchases are associated with neither underinvestment nor excessive executive pay; if anything, they are carried out by highly profitable firms. Combined with Fried & Wang's (2019) estimate that net payouts amount to 41%, the claim that "payouts are crowding out investment" finds no support in large-scale data. The United States, for example, has levied a 1% excise tax on buybacks since 2023, yet the "suppression of investment" cited as its justification rests on weak empirical ground.
Large companies are retreating from science: Using data on roughly 800,000 corporate research papers published between 1980 and 2015, Arora et al. (2021) showed that the more readily research findings leak to competitors, the more firms withdraw from basic research. In other words, even when the social return on basic research is high, the structure of incentives makes it rational for any individual company not to invest.
Ideas are getting harder to find: Bloom et al. (2020) showed that US research productivity is falling at a rate of more than 5% per year, halving every 13 years. The practical implication is that even if an R&D budget is held flat in nominal terms, allocation decisions must assume that its real output erodes every year.
PE fund "persistence" cannot be exploited in advance: Harris et al. (2023) showed that while both buyout and venture capital funds exhibit persistence when judged by their final performance, using only the information available at the time of fundraising, persistence has all but vanished for buyout funds raised since 2000 and survives only in VC. The strategy of "backing managers whose previous fund was in the top quartile," for instance, no longer works for buyouts.
Corporate venture capital is launched to plug gaps in in-house innovation and wound down once they recover: Analyzing 381 CVC units, Ma (2020) found that CVC programs tend to be started after a decline in the number or quality of a company's internal patents and terminated once that weakness has been repaired. In practice, treating CVC as a "time-limited vehicle for learning" rather than a "permanent investment arm" is closer to what the research actually observes.
The advantage of programmatic M&A has held consistently for more than 20 years: In McKinsey's latest analysis (Daume et al., 2021), companies that kept making small and mid-sized acquisitions earned excess shareholder returns of about 2 percentage points a year, with 65% in positive territory, whereas large one-off deals were a coin toss and companies that made no acquisitions at all performed worst. Bain & Company (2024) likewise reports that the shareholder-return advantage of frequent acquirers has widened from 57% in 2000–2010 to roughly 130% today. What separates M&A success from failure, in other words, is not "whether to acquire" but "at what size, at what frequency, and with what capabilities."
Behavioral factors shape M&A outcomes: Synthesizing 188 behavioral M&A studies published between 2008 and 2018, Devers et al. (2020) found that CEO overconfidence and narcissism encourage value-destroying acquisitions, while closely related assets, the purchase of divested assets, partial acquisitions, and independent boards improve results. Building an independent perspective into the deal-approval process, for instance, is a more effective form of governance than scrutinizing individual deals one by one.
Accelerators work—"depending on their design": In a quasi-experiment comparing accepted applicants with narrowly rejected ones, Hallen et al. (2020) showed that graduating companies raised 47–171% more funding, and attributed the effect to intensive early-stage learning. For corporate-run accelerators, too, outcomes hinge on a design that front-loads advice and makes progress transparent.
Companies that experiment grow faster—and fail faster: Koning et al. (2022) showed that startups adopting A/B testing saw improved growth metrics and more new product launches, along with a wider dispersion between success and failure. An experimentation system, in other words, does more than raise the odds of success: it confirms failures sooner and frees up capital.
Generative AI has large effects on the front line, but they are still hard to see in corporate P&L: Brynjolfsson et al. (2025) report a +14% productivity gain in customer support (+34% for novices); Noy & Zhang (2023) a 40% reduction in time and an 18% improvement in quality for writing tasks; and Dell'Acqua et al. (2023) a quality gain of more than 40% in consulting tasks where AI excels but a 19-point drop in accuracy where it does not. Meanwhile, a McKinsey & Company (2025) survey finds that although 88% of organizations use AI, only 39% report any impact on enterprise-wide EBIT. The gap between task-level and firm-level effects can be explained by whether or not complementary organizational investments (Brynjolfsson et al., 2021) have been made.
Estimates of AI's macroeconomic effect differ by more than tenfold between optimists and skeptics: Using a task-based model, Acemoglu (2025) estimated that generative AI would lift TFP by at most 0.66% over ten years (roughly 0.07% a year). Eloundou et al. (2024) estimate that about 80% of US workers could see at least 10% of their tasks affected by LLMs, and about 19% could see at least 50% affected. Starting from the same exposure data, the macro estimate swings widely depending on how much cost reduction per task one assumes.
Fewer than 1% of megaprojects succeed: Drawing on data from more than 16,000 projects, Flyvbjerg & Gardner (2023) report that 91.5% overran their budget or schedule, and only 0.5% delivered on budget, on schedule, and with the promised benefits. Plans for major investments should therefore build in a contingency from the outset, based on the actual distribution of outcomes in the relevant reference class.
Companies are excessively risk-averse at the level of individual projects: Lovallo et al. (2020) pointed out that because middle managers stake their careers on each individual project, the company as a whole ends up unable to take small bets. The prescription is to aggregate risk at the corporate level and to evaluate individuals on the quality of their decisions rather than on the outcomes of their projects.
The value of marketing investment shows up in firm value through customer equity: Synthesizing 285 empirical studies, Edeling et al. (2021) documented findings such as a firm-value elasticity of customer equity of 0.72 and annual excess returns of 10.8% from customer satisfaction, while also showing that 20% of companies cut marketing to boost short-term profits—a practice that is harmful over the long run. Cutting marketing investment, in short, destroys more long-term value than managing accounting earnings ever could.
What practitioners say
Capital allocation is the CEO's most important job: Quantifying how US companies deployed capital from 1970 to 2024, Mauboussin & Callahan (2025) state that "capital allocation is the CEO's most important responsibility" and that capital unable to earn its cost over the long run destroys value. The eight CEOs profiled by Thorndike (2012) likewise spent more of their time on capital allocation than on running operations. In Mauboussin & Callahan's (2025) data, for example, the acquirer's share price fell on the announcement in 60% of cases, only 36% of companies met their cost-synergy targets, and just 17% met their revenue-synergy targets.
Good businesses over cash—but wait if there are no opportunities: Buffett (2025) wrote that "Berkshire will never prefer ownership of cash-equivalent assets over the ownership of good businesses," while also noting that "often, nothing looks compelling; very infrequently we find ourselves knee-deep in opportunities," explaining the company's record cash pile as the result of a shortage of opportunities. In 2024, for instance, Berkshire sold more than $134 billion in stock and repurchased no shares in the fourth quarter.
Buybacks depend on price: Buffett (2024) wrote that "all stock repurchases should be price-dependent: what is sensible at a discount to business value becomes stupid if done at a premium," and Mauboussin & Callahan (2025) likewise hold as a golden rule that a company should "buy back shares only when the stock price is below expected value." Apple, for example, returned $29 billion to shareholders in the second quarter of 2025 against operating cash flow of $24 billion, and authorized a new $100 billion buyback program (Apple, 2025).
Bet boldly for long-term market leadership: Bezos (1998) declared that Amazon would "make investment decisions in light of long-term market leadership considerations rather than short-term profitability considerations or short-term Wall Street reactions" and would "make bold rather than timid investment decisions," and Bezos (2016) argued that a bet with a 10% chance of a 100x payoff should always be taken. For instance, Bezos (2017) distinguished between irreversible "one-way door" decisions and reversible "two-way door" decisions, holding that the latter should be made quickly and with limited information.
Fire bullets, then cannonballs: Collins & Hansen (2011) reported that companies that first calibrated their aim with low-cost, low-risk experiments before committing major resources delivered ten times the performance of their peers in uncertain environments. For instance, "uncalibrated cannonballs"—large bets placed before any validation—were correlated with disaster.
Stack up small acquisitions at disciplined prices: Leonard (2016) of Constellation Software described continuously acquiring small software companies while holding firm to a high hurdle rate, observing that "hurdle rates act like magnets: once you lower them, the expected returns on subsequent deals get pulled toward the new level." Danaher built its acquisition track record by transplanting its own management system (the Danaher Business System) into acquired companies, reallocating 66% of its capital between 1990 and 2009 and delivering annual shareholder returns of 25% (Hall et al., 2012). What the two companies share is that, rather than making one large acquisition, they repeat the same type of acquisition under the same discipline.
Separate focus on the core from speculative bets: When restructuring Google into the Alphabet holding company, Page (2015) stated that the aim was to combine "focus on the core business" with "rigorous management of capital allocation," managing speculative ventures separately. For instance, the holding-company structure can be seen as institutionalizing, on the capital-allocation side, the "ambidextrous management" discussed in Chapter 3.
An extreme case of concentrated investment: In 2025, SoftBank Group committed to investing up to $40 billion in OpenAI; as of the end of June 2026, its cumulative investment of $44.6 billion carried a fair value of $89.6 billion (SoftBank Group, 2025, 2026). Vision Fund 1 and Vision Fund 2 had cumulative invested capital of $87.2 billion and $109.8 billion, respectively, with cumulative gross gains of $26.6 billion and $21.3 billion (SoftBank Group, 2026). As this illustrates, extremely concentrated bets generate both enormous valuation gains and losses, and the resulting profit or loss is determined by swings in valuation.
Strategic investments in the AI era differ from the past in both scale and structure: Following OpenAI's restructuring in October 2025, Microsoft holds a stake of roughly 27% (valued at approximately $135 billion), and OpenAI has committed to purchasing $250 billion of Azure services (Microsoft, 2025). NVIDIA signed a letter of intent to invest up to $100 billion in OpenAI in stages (OpenAI, 2025) and invested $5 billion in Intel (NVIDIA, 2025). "Circular" investments of this kind—where a supplier takes stakes in its customers or competitors and uses capital to underpin demand within its own ecosystem—cannot be fully assessed within the conventional corporate venture capital framework.
For AI investment, "the risk of underinvesting is greater": On Alphabet's 2024 earnings call, Pichai stated that "when we go through a curve like this, the risk of under-investing is dramatically greater than the risk of over-investing" (Alphabet, 2024), and Microsoft's Nadella likewise framed the company's investments as "long-term assets that will drive growth over the next decade and beyond" (Microsoft, 2024). By way of scale, the combined 2025 capital expenditure of the four major hyperscalers reached roughly $410 billion.
AI investment is not matched by revenue: Countering this view, Cahn (2024) of Sequoia Capital worked backward from NVIDIA's data-center revenue to argue that justifying AI infrastructure investment would require $600 billion in annual revenue—leaving a gap of $500 billion against current levels. In a Goldman Sachs (2024) report, the firm's Covello argued that "AI technology is not designed to solve the complex problems that would justify the costs," and in the same report Acemoglu likewise maintained that the effects would be limited. Given that speculative frenzies have recurred throughout the diffusion phase of new technologies (Cahn, 2024), the question "Is the investment justified?" needs to be broken down, company by company, into "What is our own investment meant to obtain?"
Payouts or reinvestment: Lazonick (2014) criticized S&P 500 companies for devoting 54% of their profits to share buybacks and 37% to dividends, leaving them without funds for investment and wages. Fried & Wang (2018) countered that net payouts, after deducting share issuance, amount to only 41%, and that investment levels are close to all-time highs. In effect, the two sides are looking at the same data on a "gross" versus a "net" basis, and which figure one uses reverses the policy conclusion.
The failure of allocation skewed toward cost cutting: Kraft Heinz, known for the 3G Capital playbook, prioritized cost reductions through zero-based budgeting; the resulting underinvestment in its brands led to a $15.4 billion impairment and a dividend cut in 2019 (Kraft Heinz, 2019). It is a textbook case of capital allocation that maximized only the profit lever while neglecting the growth and risk levers.
Invest according to the power law: Thiel & Masters (2014) argued that because venture returns follow a power law—in which a single success outweighs the rest of the fund combined—they invest only in companies that have the potential to return the entire fund. The same logic applies to a portfolio of new businesses: ventures that aim for "average success" contribute almost nothing to the portfolio's overall return.
Conclusion
Drawing on the latest research and practitioner insights, this article has offered a comprehensive overview of the thinking and processes behind optimal corporate investment and capital allocation. We hope these generalized findings, which apply regardless of a company's stage or line of business, will help readers design initiatives with a higher probability of success.
References
Acemoglu, D. (2025). The simple macroeconomics of AI. Economic Policy, 40(121), 13–58. https://doi.org/10.1093/epolic/eiae042 Summary: Using a task-based macroeconomic model, estimates that generative AI will lift TFP by at most 0.66% over ten years (roughly 0.07% per year), cautioning against inflated expectations.
Adner, R., & Levinthal, D. A. (2004). What is not a real option: Considering boundaries for the application of real options to business strategy. Academy of Management Review, 29(1), 74–85. Summary: Argues that real-options logic works only for investments with clear abandonment conditions and a fixed scope; in exploratory investments, sunk costs and career incentives cause abandonment to be deferred.
Allen, J. W., & Phillips, G. M. (2000). Corporate equity ownership, strategic alliances, and product market relationships. Journal of Finance, 55(6), 2791–2815. Summary: Analyzing 402 acquisitions of equity stakes of 5% or more, shows that minority investments accompanied by alliances or joint ventures raise the target's share price (+9.1%) and investment (+58.4%), while returns to the investing firm are not significant.
Almeida, H., Fos, V., & Kronlund, M. (2016). The real effects of share repurchases. Journal of Financial Economics, 119(1), 168–185. Summary: Provides evidence that firms on track to narrowly miss EPS forecasts use share buybacks to lift EPS, and subsequently cut capital expenditure, R&D, and employment.
Alphabet Inc. (2024, July 23). Q2 2024 earnings call transcript. Summary: Transcript of the earnings call in which CEO Pichai said of AI infrastructure that "the risk of under-investing is dramatically greater than the risk of over-investing" and explained the quarter's $13 billion in capital expenditure.
Andrade, G., Mitchell, M., & Stafford, E. (2001). New evidence and perspectives on mergers. Journal of Economic Perspectives, 15(2), 103–120. Summary: Shows that for U.S. mergers from 1973 to 1998, the stock-price reaction at announcement was +16% for targets, −0.7% for acquirers, and +1.8% combined, meaning the gains accrue to target shareholders.
Apple Inc. (2025, May 1). Apple reports second quarter results [Press release]. https://www.apple.com/newsroom/2025/05/apple-reports-second-quarter-results/ Summary: Announced that Apple returned $29 billion to shareholders in the second quarter of 2025 and authorized a new $100 billion share repurchase program.
Arkes, H. R., & Blumer, C. (1985). The psychology of sunk cost. Organizational Behavior and Human Decision Processes, 35(1), 124–140. Summary: Demonstrates experimentally that, even though money already spent is rationally irrelevant, people keep using things they paid more for, distorting their judgment.
Arora, A., Belenzon, S., & Sheer, L. (2021). Knowledge spillovers and corporate investment in scientific research. American Economic Review, 111(3), 871–898. https://doi.org/10.1257/aer.20171742 Summary: Using data on roughly 800,000 corporate scientific papers from 1980 to 2015, shows that the greater the spillovers to competitors, the more firms withdraw from basic research.
Association for Financial Professionals. (2024). 2024 AFP liquidity survey. Summary: Survey reporting that, after the U.S. bank failures of March 2023, 45% of corporate treasurers moved deposits to large banks, and that companies hold 47% of their cash in bank deposits and 12% in government securities.
Baghai, M., Coley, S., & White, D. (1999). The alchemy of growth: Practical insights for building the enduring enterprise. Perseus Books. Summary: Presents a growth framework built on managing three horizons simultaneously: today's core businesses, emerging new businesses, and the seeding of future options.
Bain & Company. (2014). Mastering the good breakup. https://www.bain.com/insights/mastering-the-good-breakup/ Summary: An analysis of 40 spin-offs with enterprise values above $1 billion, showing that outcomes are polarized between the top third (gains of over 50%) and the bottom third (losses of 40%), and that on average spin-offs do not beat the market.
Bain & Company. (2024). How companies got so good at M&A. https://www.bain.com/insights/how-companies-got-so-good-at-m-and-a/ Summary: Drawing on roughly 20 years and 660,000 deals, shows that the shareholder-return advantage of companies making at least one acquisition a year widened from 57% in 2000–2010 to about 130%, confirming the edge enjoyed by frequent acquirers.
Bain & Company. (2025). Global M&A report 2025. https://www.bain.com/insights/topics/m-and-a-report/ Summary: Reports that global M&A value recovered to roughly $3.5 trillion in 2024 (up 15%), and that frequent acquirers delivered total shareholder returns of 8.5% a year, more than double the 3.7% of companies that made no acquisitions.
Bamford, J., Ernst, D., & Fubini, D. G. (2004). Launching a world-class joint venture. Harvard Business Review, 82(2), 90–100. Summary: Argues that joint ventures succeed about as rarely as M&A deals, and that the decision-making mechanisms and staffing put in place during the first 100 days after launch determine success or failure.
Bardolet, D., Fox, C. R., & Lovallo, D. (2011). Corporate capital allocation: A behavioral perspective. Strategic Management Journal, 32(13), 1465–1483. Summary: Uses experiments and real-world data to demonstrate "naive diversification," the tendency of executives to spread capital evenly across business units, so that allocations shift depending on how the units are carved up.
Bates, T. W., Kahle, K. M., & Stulz, R. M. (2009). Why do U.S. firms hold so much more cash than they used to? Journal of Finance, 64(5), 1985–2021. Summary: Shows that the cash-to-assets ratio of U.S. firms doubled from 10.5% in 1980 to 23.2% in 2006, driven mainly by precautionary motives in response to rising cash-flow risk.
Begenau, J., & Palazzo, B. (2021). Firm selection and corporate cash holdings. Journal of Financial Economics, 139(3), 697–718. Summary: Shows that the rise in cash ratios among U.S. listed firms can be explained by a selection effect: R&D-intensive, low-margin companies have been going public with high cash holdings.
Belderbos, R., Carree, M., & Lokshin, B. (2004). Cooperative R&D and firm performance. Research Policy, 33(10), 1477–1492. Summary: Using data on Dutch firms, shows that joint R&D with universities and competitors boosts sales growth from products aimed at new markets, while joint R&D with suppliers contributes to labor productivity growth.
Berger, P. G., & Ofek, E. (1995). Diversification's effect on firm value. Journal of Financial Economics, 37(1), 39–65. Summary: Estimates that between 1986 and 1991, diversified firms were worth on average 13–15% less than the sum of their business segments valued as stand-alone companies.
Bessembinder, H. (2018). Do stocks outperform Treasury bills? Journal of Financial Economics, 129(3), 440–457. Summary: Shows that 58% of the roughly 26,000 U.S. stocks listed between 1926 and 2016 underperformed Treasury bills, and that the top 4% of stocks accounted for all net wealth creation.
Bessemer Venture Partners. (2021). Scaling to $100 million. https://www.bvp.com/atlas/scaling-to-100-million Summary: A practitioner benchmark giving guideposts for cloud companies at each growth stage, including the efficiency score (growth rate plus free-cash-flow margin) and retention rates.
Bezos, J. (1998). 1997 letter to shareholders. Amazon.com. https://www.aboutamazon.com/news/company-news/amazons-original-1997-letter-to-shareholders Summary: Amazon's founding declaration that it would judge investments by long-term market leadership rather than short-term profit, and that it would make bold bets.
Bezos, J. (2015). 2014 letter to shareholders. Amazon.com. Summary: Positions Marketplace, Prime, and AWS as three large businesses born from bold bets, and lays out the characteristics of an ideal business.
Bezos, J. (2016). 2015 letter to shareholders. Amazon.com. Summary: States that "you should always take a bet with a 10% chance of a 100x payoff," and introduces the distinction between irreversible and reversible decisions.
Bezos, J. (2017). 2016 letter to shareholders. Amazon.com. https://www.aboutamazon.com/news/company-news/2016-letter-to-shareholders Summary: Argues that to stay in "Day 1" mode, companies should decide once they have about 70% of the information they wish they had, and should make reversible decisions quickly through a lightweight process.
Birshan, M., Engel, M., & Sibony, O. (2013). Avoiding the quicksand: Ten techniques for more agile corporate resource allocation. McKinsey Quarterly. Summary: Points out that allocations typically carry over more than 90% of the prior year's pattern (resource inertia), and sets out ten techniques to counter it, including budget meetings premised on reallocation, counter-anchors drawn from external data, a discretionary CEO fund, and routine divestitures.
Bloom, N., Eifert, B., Mahajan, A., McKenzie, D., & Roberts, J. (2013). Does management matter? Evidence from India. Quarterly Journal of Economics, 128(1), 1–51. Summary: A randomized experiment that provided free management consulting to Indian textile plants, finding a 17% productivity gain in the first year and roughly $300,000 in additional annual profit per plant.
Bloom, N., Jones, C. I., Van Reenen, J., & Webb, M. (2020). Are ideas getting harder to find? American Economic Review, 110(4), 1104–1144. Summary: Shows that U.S. research productivity is falling at more than 5% a year, with ever more researchers needed to achieve the same output.
Bloom, N., Sadun, R., & Van Reenen, J. (2017). Management as a technology? (NBER Working Paper No. 22327). National Bureau of Economic Research. Summary: Using data on more than 11,000 firms in 34 countries, shows that the quality of management practices explains about 30% of TFP differences both within and across countries.
Bradley, C., Hirt, M., & Smit, S. (2018). Strategy beyond the hockey stick: People, probabilities, and big moves to beat the odds. Wiley. Summary: Based on an analysis of 2,393 large companies worldwide, identifies a "power curve" in which economic profit is concentrated in the top 20%, and argues that "big moves" such as programmatic M&A, capital reallocation, and aggressive capital expenditure raise the odds of moving up the curve.
Brav, A., Graham, J. R., Harvey, C. R., & Michaely, R. (2005). Payout policy in the 21st century. Journal of Financial Economics, 77(3), 483–527. Summary: A survey of 384 financial executives showing that dividends are a sticky commitment that is hard to cut, whereas share buybacks are made flexibly out of whatever cash remains after investment plans are set.
Brealey, R. A., Myers, S. C., Allen, F., & Edmans, A. (2022). Principles of corporate finance (14th ed.). McGraw Hill. Summary: A corporate finance textbook covering the standard tools of investment appraisal, including NPV, IRR, the profitability index, and project selection under capital rationing.
Brynjolfsson, E., & Hitt, L. M. (2000). Beyond computation: Information technology, organizational transformation and business performance. Journal of Economic Perspectives, 14(4), 23–48. Summary: Shows that each dollar of IT capital is associated with roughly $10 of market value, most of it attributable to complementary intangible assets such as the organizational transformation that accompanies IT.
Brynjolfsson, E., & Hitt, L. M. (2003). Computing productivity: Firm-level evidence. Review of Economics and Statistics, 85(4), 793–808. Summary: Using data on 527 U.S. firms, shows that the productivity effect of IT investment is on par with ordinary returns to capital over a one-year horizon but grows to as much as five times that level over five to seven years.
Brynjolfsson, E., Li, D., & Raymond, L. (2025). Generative AI at work. Quarterly Journal of Economics, 140(2), 889–942. https://doi.org/10.1093/qje/qjae044 Summary: Shows that rolling out generative AI to more than 5,000 customer-support agents raised productivity by 14% on average, and by 34% among less experienced agents.
Brynjolfsson, E., Rock, D., & Syverson, C. (2021). The productivity J-curve: How intangibles complement general purpose technologies. American Economic Journal: Macroeconomics, 13(1), 333–372. https://doi.org/10.1257/mac.20180386 Summary: Proposes the "productivity J-curve," whereby productivity is understated in the early phase of adopting a general-purpose technology because the complementary intangible investments go unmeasured.
Buffett, W. E. (1985). Chairman's letter to the shareholders of Berkshire Hathaway Inc. (1984 annual report). https://www.berkshirehathaway.com/letters/1984.html Summary: The original source of the "one-dollar test"—the principle that earnings should be retained only when each dollar retained can be expected to create at least one dollar of market value.
Buffett, W. E. (1996). An owner's manual. Berkshire Hathaway Inc. https://www.berkshirehathaway.com/owners.html Summary: Codifies the one-dollar test as a guiding principle for shareholders and pledges never to make acquisitions that ignore long-term economics or to issue shares below their intrinsic value.
Buffett, W. E. (2024). Letter to the shareholders of Berkshire Hathaway Inc. (2023 annual report). https://www.berkshirehathaway.com/letters/2023ltr.pdf Summary: Argues that share repurchases are entirely a matter of price: sensible when made below intrinsic value, foolish when made above it.
Buffett, W. E. (2025). Letter to the shareholders of Berkshire Hathaway Inc. (2024 annual report). https://www.berkshirehathaway.com/letters/2024ltr.pdf Summary: Explains, with respect to Berkshire's record cash holdings, that it would never prefer holding cash equivalents to owning good businesses, and that the cash pile reflects a shortage of opportunities.
Cahn, D. (2024). AI's $600B question. Sequoia Capital. https://www.sequoiacap.com/article/ais-600b-question/ Summary: Working backward from NVIDIA's data-center revenue, estimates that justifying current AI infrastructure investment would require $600 billion in annual revenue, leaving a $500 billion gap against today's reality.
Cambridge Associates. (2025). US venture capital index and selected benchmark statistics, September 30, 2024. Summary: A benchmark of 2,579 U.S. VC funds showing how sharply results vary by period: the 10-year pooled IRR of 14.57% beats public equities, while the trailing one-year figure is just 3.23%.
Campa, J. M., & Kedia, S. (2002). Explaining the diversification discount. Journal of Finance, 57(4), 1731–1762. Summary: Shows that once you control for the self-selection of lower-valued firms into diversification, the diversification discount shrinks or disappears, and in some cases turns into a premium.
Cao, B., Jiang, B., & Koller, T. (2006). Balancing ROIC and growth to build value. McKinsey on Finance, Spring 2006. Summary: Shows that ROIC levels are highly persistent over a ten-year span, whereas high growth reverts quickly to the mean—so growth investment creates value only for companies that already earn a high ROIC.
CB Insights. (2025). State of CVC 2024. Summary: Reports that CVC-backed funding reached $65.9 billion in 2024 (up 20%), with AI accounting for 37% of the total, and that CVCs participated in roughly 28% of venture deals worldwide.
Chao, J., Rinaudo, E. K., & Uhlaner, R. (2014). Avoiding blind spots in your next joint venture. McKinsey & Company. Summary: Based on a survey of JV practitioners at 30 S&P 500 companies, reports that 40–60% of completed joint ventures fell short of their potential.
Chesbrough, H. W. (2002). Making sense of corporate venture capital. Harvard Business Review, 80(3), 90–99. Summary: Classifies CVC investments into four types—driving, enabling, emergent, and passive—based on their objective (strategic vs. financial) and the tightness of their link to the core business.
Christensen, C. M. (1997). The innovator's dilemma: When new technologies cause great firms to fail. Harvard Business School Press. Summary: Shows how the logic of the existing business blocks investment in disruptive technologies, laying the foundation for the principle of incubating new ventures in separate, autonomous organizations.
Christofferson, S. A., McNish, R. S., & Sias, D. L. (2004). Where mergers go wrong. McKinsey Quarterly, (2), 92–99. Summary: An analysis of 160 mergers finding that roughly 70% failed to achieve their planned revenue synergies, while only about 60% came close to delivering their cost synergies.
Collins, J., & Hansen, M. T. (2011). Great by choice: Uncertainty, chaos, and luck—Why some thrive despite them all. HarperBusiness. Summary: Shows that companies that calibrate their aim with low-cost experiments ("bullets") before committing major resources ("cannonballs") delivered tenfold results in uncertain environments.
Cooper, M. J., Gulen, H., & Schill, M. J. (2008). Asset growth and the cross-section of stock returns. Journal of Finance, 63(4), 1609–1651. Summary: Documents the "asset growth anomaly": firms with higher total asset growth earn lower stock returns the following year, with the value-weighted spread between the top and bottom deciles reaching 8.4% per year.
Corrado, C., Hulten, C., & Sichel, D. (2009). Intangible capital and U.S. economic growth. Review of Income and Wealth, 55(3), 661–685. Summary: Estimates that intangible investment by U.S. firms reached roughly $1 trillion in 1999, matching tangible investment, and rose to 1.36 times tangible investment over 2000–2003.
Correlation Ventures. (2014). Venture outcomes are even more skewed than you think. Summary: An analysis of more than 20,000 U.S. VC investments showing that 65% lost money and only 4% returned 10x or more.
Crouzet, N., & Eberly, J. (2023). Rents and intangible capital: A q+ framework. Journal of Finance, 78(4), 1873–1916. https://doi.org/10.1111/jofi.13231 Summary: Shows that most of the "investment gap"—the weakness of tangible investment relative to firm valuations—is explained by intangible assets rather than market power.
Damodaran, A. (2026). Capital expenditures by sector (US). NYU Stern School of Business. https://pages.stern.nyu.edu/~adamodar/ Summary: A dataset compiling net capital expenditure as a share of revenue by industry, showing wide variation: over 30–40% for utilities, 18–26% for software, and roughly 4% for the market as a whole.
Daume, P., Lundberg, T., McCurdy, P., Rudnicki, J., & Wol, L. (2021). How one approach to M&A is more likely to create value than all others. McKinsey Quarterly. Summary: An analysis of 2,000 large companies worldwide showing that programmatic acquirers—those making a steady stream of small and mid-sized deals—earned roughly 2 percentage points of excess shareholder returns per year, with 65% in positive territory, whereas large one-off deals were a coin toss and companies that made no acquisitions at all performed worst.
Dell'Acqua, F., McFowland, E., III, Mollick, E. R., Lifshitz-Assaf, H., Kellogg, K. C., Rajendran, S., Krayer, L., Candelon, F., & Lakhani, K. R. (2023). Navigating the jagged technological frontier: Field experimental evidence of the effects of AI on knowledge worker productivity and quality (Harvard Business School Working Paper No. 24-013). Summary: In a field experiment with 758 consultants, AI raised the number of tasks completed by 12.2% and quality by more than 40% in areas where it excels, while accuracy fell by 19 percentage points in areas where it does not.
Deloof, M. (2003). Does working capital management affect profitability of Belgian firms? Journal of Business Finance & Accounting, 30(3–4), 573–588. Summary: Using data on 1,009 large Belgian firms, shows that shorter receivables collection periods and fewer inventory days are associated with higher profitability.
Devers, C. E., Wuorinen, S., McNamara, G., Haleblian, J., Gee, I. H., & Kim, J. (2020). An integrative review of the emerging behavioral acquisition literature: Charting the next decade of research. Academy of Management Annals, 14(2), 869–907. Summary: Synthesizes 188 behavioral M&A studies published between 2008 and 2018, mapping how CEO overconfidence, experience, asset similarity, and governance shape acquisition outcomes.
Dimson, E., Marsh, P., & Staunton, M. (2025). UBS global investment returns yearbook 2025. UBS. Summary: Drawing on data from 35 markets spanning 1900–2024, shows that equities delivered a real return of 5.2% per year, far outpacing bonds (1.7%) and Treasury bills (0.5%), with U.S. equities returning roughly 6.6% in real terms.
Dittmar, A., & Mahrt-Smith, J. (2007). Corporate governance and the value of cash holdings. Journal of Financial Economics, 83(3), 599–634. Summary: Shows that in poorly governed firms the market values a dollar of cash at only $0.42–$0.88, and that good governance roughly doubles that value.
Dixit, A. K., & Pindyck, R. S. (1994). Investment under uncertainty. Princeton University Press. Summary: Systematized the insight that when investments are irreversible and the future is uncertain, committing capital means giving up the "option to wait," so a positive NPV alone is not sufficient justification.
Dushnitsky, G., & Lenox, M. J. (2006). When does corporate venture capital investment create firm value? Journal of Business Venturing, 21(6), 753–772. Summary: Using data on 1,173 U.S. public companies, shows that CVC is positively related to Tobin's q, but the effect is confined to strategically motivated CVC; financially motivated CVC can actually destroy value.
Dyer, J. H., Kale, P., & Singh, H. (2004). When to ally and when to acquire. Harvard Business Review, 82(7/8), 108–115. Summary: Presents a framework for deciding whether to partner or acquire based on the type of synergy, the nature of the resources involved, market uncertainty, and the presence of competing bidders.
Edeling, A., Srinivasan, S., & Hanssens, D. M. (2021). The marketing–finance interface: A new integrative review of metrics, methods, and findings and an agenda for future research. International Journal of Research in Marketing, 38(4), 857–876. Summary: Synthesizes 285 empirical studies, finding a firm-value elasticity of customer equity of 0.72 and showing that cutting marketing to boost short-term profits is harmful over the long run.
Eloundou, T., Manning, S., Mishkin, P., & Rock, D. (2024). GPTs are GPTs: Labor market impact potential of LLMs. Science, 384(6702), 1306–1308. https://doi.org/10.1126/science.adj0998 Summary: Estimates that roughly 80% of U.S. workers could have at least 10% of their tasks affected by LLMs, and about 19% could have at least half of their tasks affected.
Faulkender, M., & Wang, R. (2006). Corporate financial policy and the value of cash. Journal of Finance, 61(4), 1957–1990. Summary: Shows that the marginal value of a dollar of cash to shareholders averages $0.94, and is lower still at firms with large cash holdings or high leverage.
Flyvbjerg, B. (2006). From Nobel Prize to project management: Getting risks right. Project Management Journal, 37(3), 5–15. Summary: The first practical application of reference class forecasting, which draws on the actual outcome distribution of comparable projects, showing that it can counter both optimism bias and strategic underestimation.
Flyvbjerg, B., & Gardner, D. (2023). How big things get done: The surprising factors that determine the fate of every project, from home renovations to space exploration. Currency. Summary: Shows that of more than 16,000 projects, 91.5% ran over budget or schedule, and only 0.5% delivered on budget, on time, and with the promised benefits.
Fornell, C., Morgeson, F. V., III, & Hult, G. T. M. (2016). Stock returns on customer satisfaction do beat the market: Gauging the effect of a marketing intangible. Journal of Marketing, 80(5), 92–107. Summary: Shows that a portfolio of companies with top customer-satisfaction scores earned excess returns of roughly 10.8% per year from 2000 to 2014.
Fried, J. M., & Wang, C. C. Y. (2018). Are buybacks really shortchanging investment? Harvard Business Review, 96(2), 88–95. Summary: Argues that net shareholder payouts, after subtracting equity issuance, amount to only 41% of net income, and that corporate investment is running near record highs.
Fried, J. M., & Wang, C. C. Y. (2019). Short-termism and capital flows. Review of Corporate Finance Studies, 8(1), 207–233. Summary: Shows that while gross shareholder payouts by S&P 500 firms equal 96% of net income, net payouts after equity issuance come to 41% across all listed companies, and that both investment and cash holdings rose over the same period.
Goldman Sachs. (2024). Gen AI: Too much spend, too little benefit? (Top of Mind, Issue 129). Goldman Sachs Global Macro Research. Summary: A report asking whether the benefits will justify more than $1 trillion in AI capital spending, presenting the skeptics (Covello, Acemoglu) alongside the optimists.
Gompers, P., & Lerner, J. (2000). The determinants of corporate venture capital success: Organizational structure, incentives, and complementarities. In R. K. Morck (Ed.), Concentrated corporate ownership (pp. 17–54). University of Chicago Press. Summary: Using 32,364 VC investments made between 1983 and 1994, shows that CVC investments with a strategic fit achieve higher success rates than independent VCs, yet CVC programs tend to be short-lived, with a median lifespan of about one year.
Gormsen, N. J., & Huber, K. (2024). Firms' perceived cost of capital (NBER Working Paper No. 32611). National Bureau of Economic Research. Summary: Shows that the cost of capital firms perceive diverges from market rates, and that firms perceiving a higher cost invest less and earn higher ROIC, evidence that capital is being misallocated.
Gormsen, N. J., & Huber, K. (2025). Corporate discount rates. American Economic Review, 115(6), 2001–2049. https://doi.org/10.1257/aer.20231246 Summary: Using earnings-call data from roughly 2,500 companies, shows that corporate discount rates exceed the perceived cost of capital by about 3 percentage points on average, and that the widening and persistence of this gap can help explain recent underinvestment.
Graham, J. R. (2000). How big are the tax benefits of debt? Journal of Finance, 55(5), 1901–1941. Summary: Shows that the tax shield from debt is worth about 9.7% of firm value, and that large, high-quality firms carry far less debt than the theoretical optimum would suggest.
Graham, J. R., & Harvey, C. R. (2001). The theory and practice of corporate finance: Evidence from the field. Journal of Financial Economics, 60(2–3), 187–243. Summary: A survey of 392 CFOs revealed that roughly 75% of firms routinely use IRR and NPV, while the payback-period method remains stubbornly popular at about 57%.
Grullon, G., & Michaely, R. (2004). The information content of share repurchase programs. Journal of Finance, 59(2), 651–680. Summary: Shows that share repurchases are not a signal of improved future performance; rather, they are explained by the lower risk that accompanies shrinking growth opportunities and by the curbing of overinvestment.
Guest, N., Kothari, S. P., & Venkat, P. (2023). Share repurchases on trial: Large-sample evidence on share price performance, executive compensation, and corporate investment. Financial Management, 52(1), 19–40. Summary: Comparing thousands of U.S. companies, the authors find that share repurchases are associated with neither underinvestment nor excessive executive pay, and that it is the more profitable firms that carry them out.
Hall, B. H., Mairesse, J., & Mohnen, P. (2010). Measuring the returns to R&D. In B. H. Hall & N. Rosenberg (Eds.), Handbook of the economics of innovation (Vol. 2, pp. 1033–1082). Elsevier. Summary: Reviewing half a century of empirical research, the authors conclude that the private rate of return on R&D generally falls in the 20–30% range, with the social rate of return far exceeding it.
Hall, R. E., & Woodward, S. E. (2010). The burden of the nondiversifiable risk of entrepreneurship. American Economic Review, 100(3), 1163–1194. Summary: Shows that roughly three-quarters of VC-backed entrepreneurs receive nothing at exit, and that the burden of non-diversifiable risk they bear is extremely heavy.
Hall, S., Lovallo, D., & Musters, R. (2012). How to put your money where your strategy is. McKinsey Quarterly. https://www.mckinsey.com/capabilities/strategy-and-corporate-finance/our-insights/how-to-put-your-money-where-your-strategy-is Summary: An analysis of 1,616 U.S. listed companies from 1990 to 2005 found that capital allocation is virtually locked in place, with a year-over-year correlation of 0.92, yet companies that actively reallocate capital deliver shareholder returns roughly 30% higher.
Hallen, B. L., Cohen, S. L., & Bingham, C. B. (2020). Do accelerators work? If so, how? Organization Science, 31(2), 378–414. Summary: Using a quasi-experiment that compares admitted startups with narrowly rejected applicants, the authors show that well-designed accelerators increase participants' funding raised by 47–171%, and that the source of this effect lies in intensive early-stage learning.
Hambrick, D. C., & Fredrickson, J. W. (2001). Are you sure you have a strategy? Academy of Management Executive, 15(4), 48–59. Summary: Introduces the "strategy diamond," a framework that structures strategy around five elements: Arenas, Vehicles, Differentiators, Staging, and Economic Logic.
Harris, R. S., Jenkinson, T., & Kaplan, S. N. (2014). Private equity performance: What do we know? Journal of Finance, 69(5), 1851–1882. Summary: Analyzing roughly 1,400 U.S. funds, the authors show that buyout funds outperformed the S&P 500 by 20–27% over the life of a fund (more than 3% per year), whereas VC funds underperformed it in the 2000s.
Harris, R. S., Jenkinson, T., Kaplan, S. N., & Stucke, R. (2023). Has persistence persisted in private equity? Evidence from buyout and venture capital funds. Journal of Corporate Finance, 81, Article 102361. https://doi.org/10.1016/j.jcorpfin.2023.102361. Summary: Shows that, using only the information available at the time a fund is raised, performance persistence has all but disappeared for buyout funds since 2000 and survives only in venture capital.
Haskel, J., & Westlake, S. (2017). Capitalism without capital: The rise of the intangible economy. Princeton University Press. Summary: Identifies the four defining properties of intangible assets (scalability, sunkenness, spillovers, and synergies) and shows that intangible investment has overtaken tangible investment in the major advanced economies.
Hayashi, F. (1982). Tobin's marginal q and average q: A neoclassical interpretation. Econometrica, 50(1), 213–224. Summary: Demonstrates that, under certain conditions, marginal q equals the observable average q, thereby making Tobin's q usable in empirical work.
Ikenberry, D., Lakonishok, J., & Vermaelen, T. (1995). Market underreaction to open market share repurchases. Journal of Financial Economics, 39(2–3), 181–208. Summary: Finds that abnormal returns in the four years following a repurchase announcement average 12.1%, rising to 45.3% for value stocks, indicating that the market fails to fully price in the information at the time of the announcement.
Jagannathan, R., Matsa, D. A., Meier, I., & Tarhan, V. (2016). Why do firms use high discount rates? Journal of Financial Economics, 120(3), 445–463. Summary: Shows that firms apply hurdle rates of roughly 15%, about twice their cost of capital, and that the reason lies not in financing constraints but in constraints on managerial resources and the value of the option to wait.
Jensen, M. C. (1986). Agency costs of free cash flow, corporate finance, and takeovers. American Economic Review, 76(2), 323–329. Summary: A classic of agency theory arguing that managers with surplus free cash flow are prone to negative-NPV investments and excessive growth, and that debt and takeovers act as disciplining forces against this.
Jordà, Ò., Knoll, K., Kuvshinov, D., Schularick, M., & Taylor, A. M. (2019). The rate of return on everything, 1870–2015. Quarterly Journal of Economics, 134(3), 1225–1298. Summary: Drawing on data from 16 countries spanning 1870–2015, the authors show that equities (6.9%) and housing (7.1%) deliver similarly high real returns, far exceeding those of bonds (2.5%) and short-term government bills (1.0%).
Kale, P., & Singh, H. (2009). Managing strategic alliances: What do we know now, and where do we go from here? Academy of Management Perspectives, 23(3), 45–62. Summary: Reviews estimates putting alliance failure rates well above 50% and argues that partner complementarity, governance, and a dedicated alliance function are what separate success from failure.
Kaplan, S. N., & Schoar, A. (2005). Private equity performance: Returns, persistence, and capital flows. Journal of Finance, 60(4), 1791–1823. Summary: Shows that the average net-of-fees return of PE funds is roughly on par with the S&P 500 but highly dispersed, and that performance persists across funds managed by the same firm.
Kelly, J. L., Jr. (1956). A new interpretation of information rate. Bell System Technical Journal, 35(4), 917–926. Summary: The original source on bet sizing, deriving the betting fraction f = p − (1 − p)/b that maximizes the long-run growth rate of wealth.
Kerr, W. R., Nanda, R., & Rhodes-Kropf, M. (2014). Entrepreneurship as experimentation. Journal of Economic Perspectives, 28(3), 25–48. Summary: Documents the highly skewed distribution of VC outcomes, in which roughly 55% of portfolio companies end in losses while the 6% that return more than 5x account for about half of total returns, and argues that this makes it rational to run many cheap experiments.
Khanna, T., & Palepu, K. (2000). Is group affiliation profitable in emerging markets? An analysis of diversified Indian business groups. Journal of Finance, 55(2), 867–891. Summary: Shows that in markets with underdeveloped institutions, diversified business groups substitute for missing market functions, and that affiliates of the most diversified groups outperform independent firms.
King, D. R., Dalton, D. R., Daily, C. M., & Covin, J. G. (2004). Meta-analyses of post-acquisition performance: Indications of unidentified moderators. Strategic Management Journal, 25(2), 187–200. Summary: A meta-analysis showing that acquirers' post-acquisition performance deteriorates slightly on average, and that conventional variables such as relatedness, method of payment, and acquisition experience fail to explain the variation.
Kohler, T. (2016). Corporate accelerators: Building bridges between corporations and startups. Business Horizons, 59(3), 347–357. Summary: A qualitative study that organizes the design elements of corporate accelerators into four categories: proposition, process, people, and place.
Koller, T., Goedhart, M., & Wessels, D. (2020). Valuation: Measuring and managing the value of companies (7th ed.). Wiley. Summary: The standard textbook systematizing the core principles of value creation: a company's value is determined by NOPAT, growth, ROIC, and WACC, and growth creates value only when ROIC exceeds WACC.
Koning, R., Hasan, S., & Chatterji, A. (2022). Experimentation and start-up performance: Evidence from A/B testing. Management Science, 68(9), 6434–6453. Summary: Shows that startups adopting A/B testing see higher growth metrics and more new product launches, while the dispersion of outcomes also widens—they grow faster and fail faster.
Konings, J., & Vanormelingen, S. (2015). The impact of training on productivity and wages: Firm-level evidence. Review of Economics and Statistics, 97(2), 485–497. Summary: Finds that workers who receive in-company training show a productivity premium of 23% and a wage premium of 12%, indicating that a substantial share of the returns to training accrues to the firm.
Korteweg, A., & Sorensen, M. (2017). Skill and luck in private equity performance. Journal of Financial Economics, 124(3), 535–562. Summary: Shows that although top- and bottom-quartile PE managers differ by 7–8 percentage points per year, the noise is so large that investors are essentially unable to identify superior managers in advance.
Kraft Heinz Company. (2019, February 21). Kraft Heinz reports fourth quarter and full year 2018 results [Press release]. Summary: Announced a $15.4 billion brand impairment and a dividend cut, becoming a widely cited example of the consequences of capital allocation skewed too heavily toward cost cutting.
Lang, L. H. P., & Stulz, R. M. (1994). Tobin's q, corporate diversification, and firm performance. Journal of Political Economy, 102(6), 1248–1280. Summary: Shows a consistently negative relationship between the degree of diversification and Tobin's q among U.S. firms in the 1980s.
Lazonick, W. (2014). Profits without prosperity. Harvard Business Review, 92(9), 46–55. Summary: Argues that 449 S&P 500 companies devoted 54% of their profits to share buybacks and 37% to dividends between 2003 and 2012, draining the funds available for investment and wages.
Lee, D., & Madhavan, R. (2010). Divestiture and firm performance: A meta-analysis. Journal of Management, 36(6), 1345–1371. Summary: A meta-analysis of the relationship between divestitures and firm performance, finding an overall positive relationship that is stronger when measured with market-based metrics.
Leonard, M. (2016). President's letter (2015). Constellation Software Inc. Summary: Describes the policy of continuing to acquire small software companies while holding firm on high hurdle rates, arguing that hurdle rates act like a magnet: once lowered, the expected returns on subsequent deals get pulled toward the new level.
Lerner, J. (2013). Corporate venturing. Harvard Business Review, 91(10), 86–94. Summary: Lays out how corporate venture capital can outperform independent VC, yet often ends up short-lived depending on how compensation, approval processes, and management commitment are designed.
Lovallo, D., & Kahneman, D. (2003). Delusions of success: How optimism undermines executives' decisions. Harvard Business Review, 81(7), 56–63. Summary: Argues that executives tend to build optimistic plans from an "inside view" and should correct them with an "outside view" based on the actual distribution of outcomes for comparable projects.
Lovallo, D., Koller, T., Uhlaner, R., & Kahneman, D. (2020). Your company is too risk-averse. Harvard Business Review, 98(2), 104–111. Summary: Identifies a structural problem in which middle managers, whose careers ride on each individual project, become strongly loss-averse, leaving the company as a whole unable to take small bets; the authors propose aggregating risk at the enterprise level.
Lucking, B., Bloom, N., & Van Reenen, J. (2019). Have R&D spillovers declined in the 21st century? Fiscal Studies, 40(4), 561–590. Summary: Shows that the marginal social return to R&D (about 58%) is roughly four times the marginal private return (about 14%), and that the magnitude of spillovers has not declined since the 1980s.
Luehrman, T. A. (1998). Strategy as a portfolio of real options. Harvard Business Review, 76(5), 89–99. Summary: Frames strategy as a portfolio of real options and presents a framework for deciding whether to invest now, abandon, or nurture and wait, based on two axes: the value-to-cost ratio and volatility.
Ma, S. (2020). The life cycle of corporate venture capital. Review of Financial Studies, 33(1), 358–394. Summary: Analyzing 381 CVC units, shows that CVC programs are launched after a decline in internal innovation and terminated once it recovers; the median lifespan is about four years, and 46% end within three years.
MacLean, L. C., Thorp, E. O., & Ziemba, W. T. (Eds.). (2011). The Kelly capital growth investment criterion: Theory and practice. World Scientific. Summary: A collection of theory and practice on the Kelly criterion, including practical variants such as "half Kelly," which halves the bet size as a safeguard against estimation error.
Malmendier, U., & Tate, G. (2005). CEO overconfidence and corporate investment. Journal of Finance, 60(6), 2661–2700. Summary: Shows that overconfident CEOs—identified by their tendency to hold their own company's stock options until expiration—overinvest when cash is readily available.
Malmendier, U., & Tate, G. (2008). Who makes acquisitions? CEO overconfidence and the market's reaction. Journal of Financial Economics, 89(1), 20–43. Summary: Shows that overconfident CEOs are 65% more likely to make acquisitions and that the market reacts significantly worse to their acquisition announcements (−0.9%).
Markowitz, H. (1952). Portfolio selection. Journal of Finance, 7(1), 77–91. Summary: The founding paper of modern portfolio theory, showing that a portfolio's value is determined by the expected return and variance (correlation) of its returns, and that combining assets with low correlation reduces risk.
Mauboussin, M. J., & Callahan, D. (2014). Capital allocation: Evidence, analytical methods, and assessment guidance. Journal of Applied Corporate Finance, 26(4), 48–74. Summary: Drawing on more than 30 years of data on the top 1,500 U.S. companies, documents that over 90% of capital comes from internal funds and compiles the evidence on trends and value creation across M&A, capital expenditures, R&D, share buybacks, and dividends.
Mauboussin, M. J., & Callahan, D. (2025). Capital allocation: Results, analysis, and assessment. Morgan Stanley Investment Management, Counterpoint Global. Summary: Quantifies how U.S. companies used capital from 1970 to 2024, positions capital allocation as the CEO's most important responsibility, and sets out the golden rule that share buybacks should be undertaken only when the stock price is below expected value.
McDonald, R., & Siegel, D. (1986). The value of waiting to invest. Quarterly Journal of Economics, 101(4), 707–727. Summary: Shows that for irreversible investments the "option to wait" has value, and that under reasonable parameters it can be optimal to wait until the benefits reach roughly twice the investment cost.
McGrath, R. G., & MacMillan, I. C. (2009). Discovery-driven growth: A breakthrough process to reduce risk and seize opportunity. Harvard Business Press. Summary: Frames a new venture as an experiment for testing assumptions, and lays out a method for releasing funding in stages at checkpoints, starting with the assumptions that are cheapest to verify.
McKinsey & Company. (2020). Why business building is the new priority for growth. Summary: Reports that while 52% of executives rank new-business building as their top growth priority, only 24% of the new businesses launched over the past decade survive as large-scale operations, and that companies that have launched four or more new businesses are more than twice as likely to earn high returns.
McKinsey & Company. (2021). 2021 global report: The state of new-business building. Summary: Reports that at least 80% of new businesses that have been operating for four or more years generate less than $50 million in annual revenue, and that more than half either earn under $1 million a year or have been shut down.
McKinsey & Company. (2025). The state of AI in 2025: Agents, innovation, and transformation. Summary: Reports that although 88% of organizations now use AI, only 39% report any impact on company-wide EBIT, and just about 6% qualify as high performers attributing 5% or more of EBIT to AI.
Microsoft. (2024). Annual report 2024: Shareholder letter. https://www.microsoft.com/investor/reports/ar24/ Summary: Positions capital expenditure on cloud and AI as long-lived assets that will drive growth for the next decade and beyond.
Microsoft. (2025, October 28). The next chapter of the Microsoft–OpenAI partnership. https://blogs.microsoft.com/blog/2025/10/28/the-next-chapter-of-the-microsoft-openai-partnership/ Summary: Announces that, following OpenAI's restructuring, Microsoft holds a stake of roughly 27% (valued at approximately $135 billion) and that OpenAI has committed to purchasing $250 billion of Azure services.
MIT NANDA. (2025). The GenAI divide: State of AI in business 2025. Massachusetts Institute of Technology. Summary: Reports that 95% of corporate generative-AI investments have contributed nothing to the bottom line; however, as a preliminary, non-peer-reviewed survey with a loose definition of success, it should be treated as directional evidence only.
Miyajima, H., & Saito, T. (2023). Kigyo tochi kaikaku to seisaku hoyu kabu no baikyaku: Sono kettei yoin to keizaiteki kiketsu [Corporate governance reform and the sale of strategic shareholdings: Determinants and economic consequences] (RIETI Policy Discussion Paper 23-P-005). Research Institute of Economy, Trade and Industry. Summary: Shows that although sales of strategic (policy) shareholdings surged after the introduction of Japan's Corporate Governance Code, the selling companies showed no clear improvement in capital expenditure, R&D, or performance.
Modigliani, F., & Miller, M. H. (1958). The cost of capital, corporation finance and the theory of investment. American Economic Review, 48(3), 261–297. Summary: The starting point of modern corporate finance, demonstrating that in a frictionless market, capital structure is irrelevant to firm value.
Modigliani, F., & Miller, M. H. (1963). Corporate income taxes and the cost of capital: A correction. American Economic Review, 53(3), 433–443. Summary: Shows that once corporate taxes are taken into account, the tax shield on debt raises firm value, laying the foundation for the trade-off theory that weighs this benefit against bankruptcy costs.
Moeller, S. B., Schlingemann, F. P., & Stulz, R. M. (2004). Firm size and the gains from acquisitions. Journal of Financial Economics, 73(2), 201–228. Summary: Across 12,023 U.S. acquisitions from 1980 to 2001, shareholders of small acquirers gained a combined $8 billion while shareholders of large acquirers lost $226 billion.
Moeller, S. B., Schlingemann, F. P., & Stulz, R. M. (2005). Wealth destruction on a massive scale? A study of acquiring-firm returns in the recent merger wave. Journal of Finance, 60(2), 757–782. Summary: Shows that acquiring-firm shareholders lost a combined $240 billion between 1998 and 2001 (12 cents for every dollar spent), with the losses concentrated in a handful of large deals by companies with extremely high valuations.
Mulherin, J. H., & Boone, A. L. (2000). Comparing acquisitions and divestitures. Journal of Corporate Finance, 6(2), 117–139. Summary: Using a sample of 1,305 U.S. companies in the 1990s, shows that divestitures as well as acquisitions create shareholder value at announcement, and that the gains scale with transaction size.
Nagji, B., & Tuff, G. (2012). Managing your innovation portfolio. Harvard Business Review, 90(5), 66–74. Summary: Reports that high-performing companies allocate their innovation investment 70% to the core, 20% to adjacent areas, and 10% to transformational initiatives, while the returns are distributed in the reverse proportion (10/20/70).
Nishiyama, K. (2026). Teika haba ga kakudai shita wagakuni kigyo no 2024-nendo no kabushiki mochiai hiritsu [Japanese companies' cross-shareholding ratio in fiscal 2024: A widening decline]. Nomura Institute of Capital Markets Research. Summary: Reports that the cross-shareholding ratio of listed companies hit a record low for the sixth consecutive year in fiscal 2024, with the steepest decline among operating companies.
Noy, S., & Zhang, W. (2023). Experimental evidence on the productivity effects of generative artificial intelligence. Science, 381(6654), 187–192. https://doi.org/10.1126/science.adh2586 Summary: Shows that on professional writing tasks, ChatGPT cut the time required by 40% and raised quality by 18%, while narrowing the performance gap between workers.
NVIDIA. (2025, September 18). NVIDIA and Intel to develop AI infrastructure and personal computing products [Press release]. Summary: Announces that NVIDIA will invest $5 billion in Intel and that the two companies will jointly develop custom CPUs and AI infrastructure.
OpenAI. (2025, September 22). OpenAI and NVIDIA announce strategic partnership to deploy 10 gigawatts of NVIDIA systems. https://openai.com/index/openai-nvidia-systems-partnership/ Summary: Announces a letter of intent under which NVIDIA will progressively invest up to $100 billion as the 10-gigawatt system deployment proceeds.
Opler, T., Pinkowitz, L., Stulz, R., & Williamson, R. (1999). The determinants and implications of corporate cash holdings. Journal of Financial Economics, 52(1), 3–46. Summary: Shows that companies with greater growth opportunities and more volatile cash flows hold a higher proportion of cash and deposits, whereas large companies with good access to capital markets hold less.
O'Reilly, C. A., III, & Tushman, M. L. (2004). The ambidextrous organization. Harvard Business Review, 82(4), 74–81. Summary: Analyzing 35 breakthrough ventures across 15 business units in nine industries, shows that more than 90% of those run in an "ambidextrous" structure—where the exploratory unit is kept separate but integrated at the senior-management level—met their goals, compared with 0–25% under other structures.
O'Reilly, C. A., III, & Tushman, M. L. (2008). Ambidexterity as a dynamic capability: Resolving the innovator's dilemma. Research in Organizational Behavior, 28, 185–206. Summary: Theorizes the ability to simultaneously exploit existing businesses and explore new domains as a dynamic capability.
Ouimet, P. P. (2013). What motivates minority acquisitions? The trade-offs between a partial equity stake and complete integration. Review of Financial Studies, 26(4), 1021–1047. Summary: Shows that minority stakes are chosen over full acquisitions when complete ownership would dilute the incentives of the target's management, or when the acquirer wants to gather information before committing to a full takeover.
Page, L. (2015). 2015 founders' letter. Alphabet Inc. https://abc.xyz/investor/founders-letters/2015/ Summary: Explains that the aim of converting Alphabet into a holding company was to combine focus on the core business with tight discipline over capital allocation, presenting a structure in which speculative ventures are managed separately.
Perkmann, M., Tartari, V., McKelvey, M., Autio, E., Broström, A., D'Este, P., Fini, R., Geuna, A., Grimaldi, R., Hughes, A., Krabel, S., Kitson, M., Llerena, P., Lissoni, F., Salter, A., & Sobrero, M. (2013). Academic engagement and commercialisation: A review of the literature on university–industry relations. Research Policy, 42(2), 423–442. Summary: A comprehensive review showing that university–industry collaboration takes place mainly through "engagement" such as joint research and consulting, rather than through patenting or startup-style commercialization.
Peters, R. H., & Taylor, L. A. (2017). Intangible capital and the investment-q relation. Journal of Financial Economics, 123(2), 251–272. Summary: Proposes a "total q" measure that incorporates intangible capital and finds that intangibles account for 42% of the total capital of US firms.
Rajan, R., Servaes, H., & Zingales, L. (2000). The cost of diversity: The diversification discount and inefficient investment. Journal of Finance, 55(1), 35–80. Summary: Provides evidence that the wider the gap in investment opportunities across divisions, the more capital flows to inefficient divisions and the larger the diversification discount becomes.
Reuters. (2023, November 28). Toyota group companies plan $4.7 billion sale of Denso stake, sources say. Summary: Reports that Toyota group companies planned to sell roughly ¥700 billion worth of Denso shares in order to unwind cross-shareholdings and fund investment in electrification.
S&P Dow Jones Indices. (2025, March 19). S&P 500 Q4 2024 buybacks increase 7.4% and 2024 expenditure sets new record by increasing 18.5% [Press release]. Summary: Reports that S&P 500 share buybacks reached a record $942.5 billion in 2024, with dividends at $629.6 billion, and that the top 20 companies accounted for roughly half of all buybacks.
Scharfstein, D. S., & Stein, J. C. (2000). The dark side of internal capital markets: Divisional rent-seeking and inefficient investment. Journal of Finance, 55(6), 2537–2564. Summary: Develops a theory of "corporate socialism," in which rent-seeking by division managers leads headquarters to over-allocate capital to weak divisions.
Sethuraman, R., Tellis, G. J., & Briesch, R. A. (2011). How well does advertising work? Generalizations from meta-analysis of brand advertising elasticities. Journal of Marketing Research, 48(3), 457–471. Summary: A meta-analysis of 56 studies finding that the sales elasticity of advertising averages 0.12 in the short run and 0.24 in the long run, that it has declined over time, and that it is lower for mature brands.
Shin, H.-H., & Soenen, L. (1998). Efficiency of working capital management and corporate profitability. Financial Practice and Education, 8(2), 37–45. Summary: Using data on roughly 59,000 US firm-years, shows that shortening the net trade cycle raises both profitability and shareholder value.
SoftBank Group Corp. (2025, April 1). SoftBank Group to invest up to $40 billion in OpenAI [Press release]. https://group.softbank/en/news/press/20250401 Summary: Announces an agreement to invest up to $40 billion in OpenAI.
SoftBank Group Corp. (2026). Consolidated financial report for the three months ended June 30, 2026. Summary: Discloses the cumulative investment and total gains of Vision Fund 1 and 2, along with a cumulative investment of $44.6 billion in OpenAI carried at a fair value of $89.6 billion.
Staw, B. M. (1976). Knee-deep in the big muddy: A study of escalating commitment to a chosen course of action. Organizational Behavior and Human Performance, 16(1), 27–44. Summary: Demonstrates experimentally the "escalation of commitment": when an investment they chose themselves fails, people tend to pour additional funds into that very project.
Stein, J. C. (1997). Internal capital markets and the competition for corporate resources. Journal of Finance, 52(1), 111–133. Summary: Argues that because headquarters holds control rights, it can create value through "winner-picking"—concentrating funds on the most promising businesses—but only across a small number of related businesses that headquarters can actually keep an eye on.
Strategy Inc. (2025, October 13). Strategy announces ATM and BTC activity updates [Form 8-K]. U.S. Securities and Exchange Commission. Summary: Discloses that, as of October 2025, the company held 640,250 BTC (acquired for a total of $47.38 billion) and was continuing to add to its holdings through issuances of common and preferred stock.
Tambe, P., Hitt, L., Rock, D., & Brynjolfsson, E. (2020). Digital capital and superstar firms (NBER Working Paper No. 28285). National Bureau of Economic Research. Summary: Shows that "digital capital"—the firm-specific intangible capital that accompanies IT—accounts for more than 25% of corporate assets, is concentrated in a small number of firms, and predicts productivity roughly three years later.
Tesla, Inc. (2023). Form 10-K for the fiscal year ended December 31, 2022. U.S. Securities and Exchange Commission. Summary: Discloses that the company sold roughly 75% of the bitcoin it purchased in 2021 during 2022 and recorded $204 million in impairment charges that year.
Thiel, P., & Masters, B. (2014). Zero to one: Notes on startups, or how to build the future. Crown Business. Summary: Sets out the principle that venture returns follow a power law and that one should invest only in companies with the potential to return the entire fund.
Thomke, S. (2020). Experimentation works: The surprising power of business experiments. Harvard Business Review Press. Summary: Drawing on examples such as the roughly 25,000 experiments Booking.com runs each year, argues that the barrier to scaling experimentation is culture, not technology.
Thorndike, W. N. (2012). The outsiders: Eight unconventional CEOs and their radically rational blueprint for success. Harvard Business Review Press. Summary: Shows that eight CEOs who placed capital allocation at the heart of management outperformed the S&P 500 by more than twentyfold, and presents a framework of five uses and three sources of capital.
Titman, S., Wei, K. C. J., & Xie, F. (2004). Capital investments and stock returns. Journal of Financial and Quantitative Analysis, 39(4), 677–700. Summary: Finds that firms that sharply increase capital expenditure subsequently earn stock returns about 2% a year lower, an effect that is especially pronounced among cash-rich, low-debt firms.
Tobin, J. (1969). A general equilibrium approach to monetary theory. Journal of Money, Credit and Banking, 1(1), 15–29. Summary: Introduces the idea that investment is determined by q, the ratio of market value to replacement cost.
Toyota Motor Corporation. (2025). Consolidated financial results (kessan tanshin) for the fiscal year ended March 31, 2025. Summary: Discloses that the company executed roughly ¥1.18 trillion in share buybacks during the fiscal year ended March 2025.
Trigeorgis, L. (1996). Real options: Managerial flexibility and strategy in resource allocation. MIT Press. Summary: Systematizes the options to defer, stage, scale, abandon, switch, and grow, and formalizes the relationship expanded NPV = static NPV + option value.
Veld, C., & Veld-Merkoulova, Y. V. (2009). Value creation through spin-offs: A review of the empirical evidence. International Journal of Management Reviews, 11(4), 407–420. Summary: A meta-analysis of 26 studies finding an average abnormal return of +3.02% at spin-off announcements, but no long-run excess returns once more rigorous methods are applied.
Villalonga, B. (2004). Diversification discount or premium? New evidence from the Business Information Tracking Series. Journal of Finance, 59(2), 479–506. Summary: Using self-reported segment data reveals a diversification discount, whereas establishment-level data reveals a diversification premium, suggesting that the discount may be an artifact of how it is measured.
Zook, C., & Allen, J. (2003). Growth outside the core. Harvard Business Review, 81(12), 66–73. Summary: Moves into adjacent businesses succeed only about 25% of the time on average, but companies with a repeatable expansion formula double that success rate, and more than 80% of the most successful moves grew out of a deeper understanding of core customers' needs.
The end
Read next ↓