
Articles
History's Fastest-Growing Companies, Nations, and Wealth Creators: Timeline, Context, and Strategies
Product
Career
Automatically translated from the Japanese original.
Introduction
What historical conditions, and what sequence of actions, have allowed the fastest-growing companies, nations, and wealthy individuals (business leaders and private investors) in history to achieve their rise? Each of these three categories has its own accumulated body of theory and methodology, yet we could find no literature that adequately examines their commonalities and differences from a cross-cutting perspective.
We take up ten companies, ten nations and regions, and ten wealthy individuals that exemplify rapid growth in recent decades. For each, we organize the time-series trajectory of their value (market capitalization, GDP, or personal wealth), the background to each turning point (policies, investments, M&A, and other actions), and the reasons why growth was so rapid—together with the amounts invested, the investment targets, and the size of the markets involved.
We also examine five companies, five nations and regions, and five wealthy individuals that failed dramatically after a period of rapid growth, and compare the success stories with the failures.
Finally, we summarize the commonalities and differences that cut across all three categories.
We hope this serves as a useful reference for anyone aiming to achieve comparable—or even greater—rapid growth in the future.
The 10 Fastest-Growing Companies
Explosive growth in corporate value (market capitalization) is, in most cases, underpinned by structures of increasing returns: software and IP that cost almost nothing to replicate, network effects whereby value rises as the user base grows, and lock-in created by switching costs (Arthur, 1989; Katz & Shapiro, 1985; Parker et al., 2016).
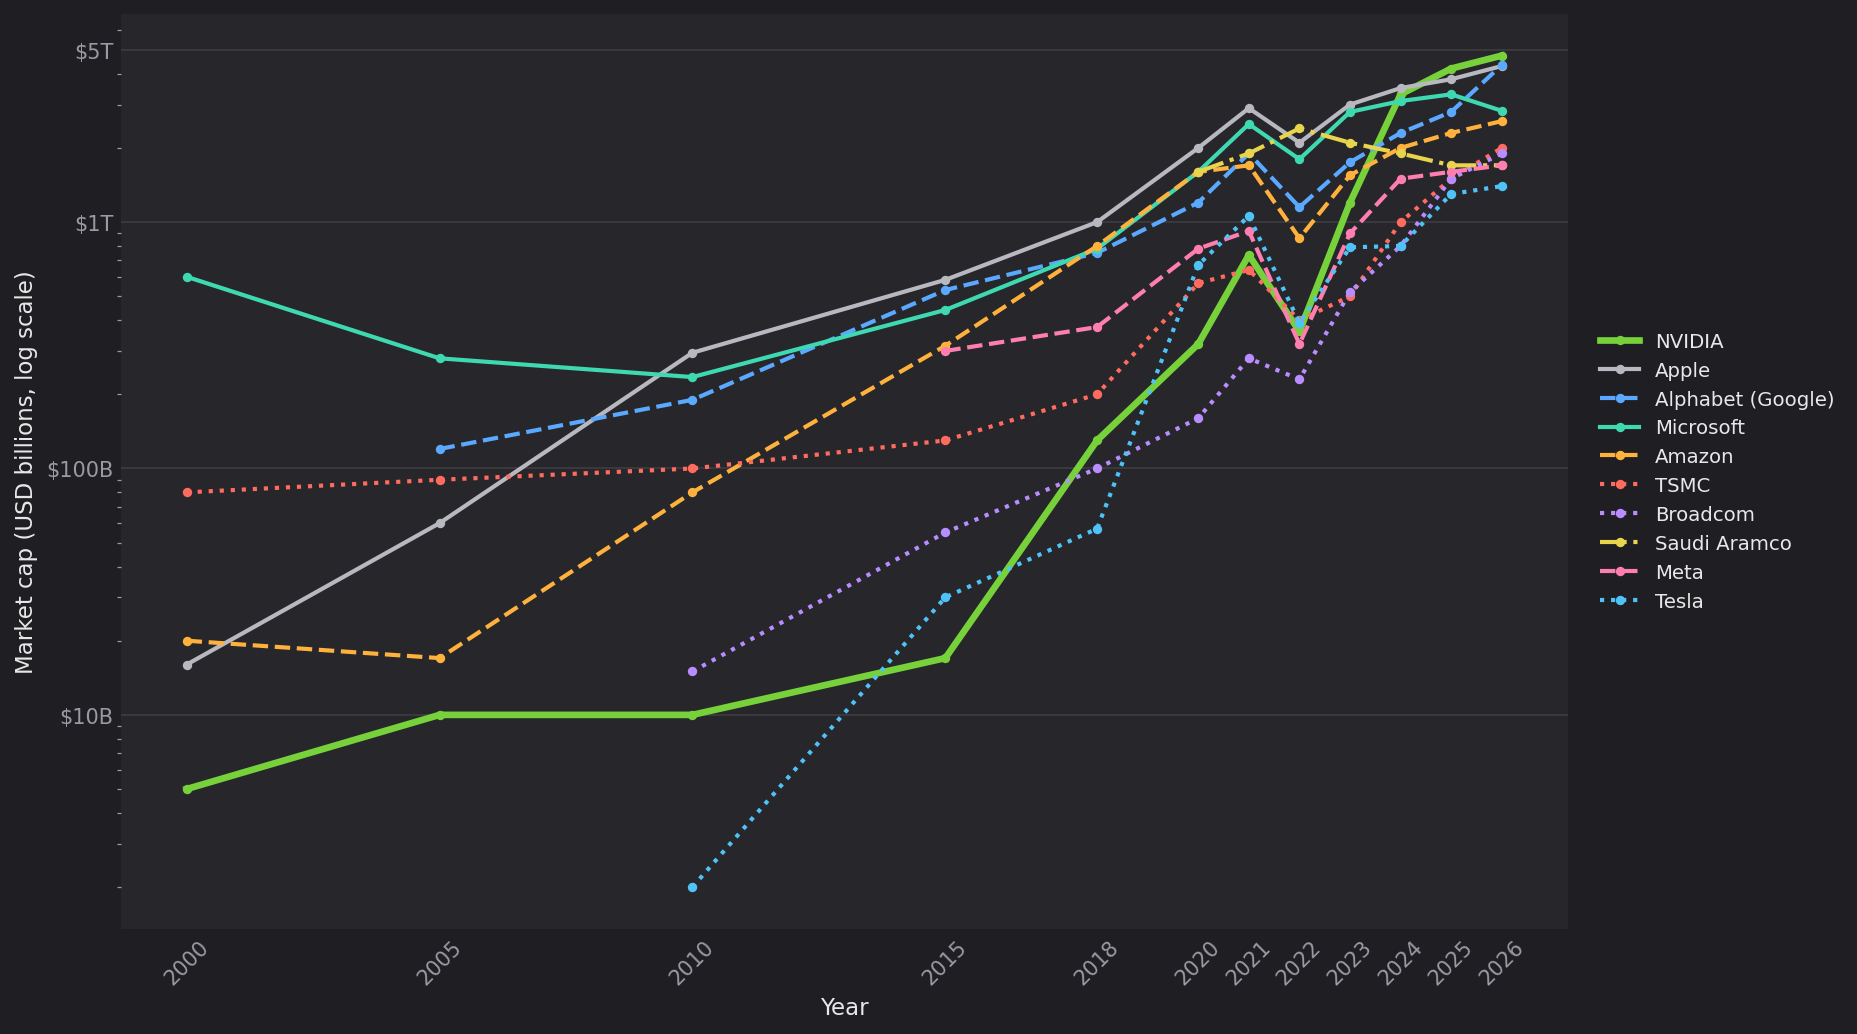
Market Capitalization Trajectories of Each Company
NVIDIA
A US semiconductor company. The world's largest maker of GPUs (graphics processing units), it now holds the de facto standard in chips for AI computing.
Action 1: Releasing CUDA (making GPUs general-purpose)
Timing: 2006
Context: GPUs were dedicated to rendering game graphics; AI and deep learning had not yet reached practical use.
Move: Released CUDA, a software platform that opened GPUs to general-purpose computing, free of charge—locking in a developer ecosystem.
Target market size and growth rate: The GPGPU market (general-purpose GPUs for AI and data centers) was essentially zero at the time / Growth rate: once established, data-center GPUs expanded at over 30% a year.
Investment: Sustained R&D spending (on the order of several hundred million dollars a year).
Outcome: Laid the groundwork for its later dominance of AI computing infrastructure; a data-center business that started from zero reached roughly $28.5 billion per quarter in 2024.
Action 2: Acquiring Mellanox (vertically integrating AI infrastructure)
Timing: 2020
Context: Expanding demand for cloud services and data centers.
Move: Acquired Mellanox, a high-speed networking company, to integrate GPUs with networking.
Target market size and growth rate: The market for high-speed data-center networking equipment was roughly $10 billion at the time / Growth rate: about 10% a year, driven by cloud demand.
Investment: Acquisition price of roughly $6.9 billion.
Outcome: Data-center revenue became the core business, and market capitalization rose from roughly $320 billion in 2020 to roughly $3.3 trillion in 2024 (roughly tenfold).
Action 3: Becoming the sole supplier of GPUs for generative AI
Timing: 2023–2025
Context: The arrival of ChatGPT triggered an explosion in demand for AI training.
Move: Became the de facto sole supplier of AI training GPUs (the H100 and others), protected by a moat built on the CUDA ecosystem, superior performance, and priority access to TSMC's manufacturing capacity.
Target market size and growth rate: Data-center GPU market of roughly $28.5 billion per quarter (2024); total semiconductor market of roughly $627.6 billion / Growth rate: data-center GPUs at over 30% a year; semiconductors overall at roughly 8% a year over the long term.
Investment: NVIDIA's R&D spending of roughly $8.7 billion a year.
Outcome: Market capitalization climbed from $1 trillion (May 2023) to $3 trillion (June 2024) to $5 trillion (October 2025)—roughly fivefold—making it the world's most valuable company.
Apple
A US technology company. One of the world's largest companies, it delivers hardware such as the iPhone and Mac together with services such as the App Store as an integrated whole.
Action 1: Launching the iPhone
Timing: 2007
Context: Mobile phones were only partway through becoming multifunctional, and smartphones were still immature.
Move: Reinvented the smartphone by integrating hardware and software.
Target market size and growth rate: The smartphone market was in its infancy at the time (it is now roughly $600 billion worldwide) / Growth rate: expanded rapidly at over 20% a year from 2007 to 2015; now around 5% a year.
Investment: Development of the original iPhone cost roughly $150 million over about 30 months.
Outcome: The iPhone became the pillar of revenue, and in August 2018 Apple became the first US company to reach a $1 trillion valuation.
Action 2: The App Store and the pivot to services
Timing: 2008 onward (the shift to services from 2015 onward)
Context: The rise of the mobile app economy and the maturing of hardware growth.
Move: Built a developer ecosystem and shifted revenue toward recurring subscription income from the App Store, iCloud, and other services.
Target market size and growth rate: The App Store ecosystem facilitated roughly $1.3 trillion in billings and sales in 2024 (of which roughly $131 billion was commission-bearing digital sales), with cumulative payouts to developers exceeding $320 billion since 2008 / Growth rate: transaction volume roughly doubled over the past five years (about 15% a year).
Investment: Apple's research and development spending runs at roughly $30 billion a year.
Outcome: High-margin services revenue expanded, taking market capitalization from $2 trillion (2020) to $3 trillion (2023).
Alphabet(Google)
A US IT company. A holding company built around the Google search engine, with businesses spanning advertising, video (YouTube), and AI.
Action 1: Search-linked advertising (AdWords)
Timing: 2000
Context: No established method yet existed for monetizing search.
Move: Introduced search-linked advertising, establishing its revenue engine.
Target market size and growth rate: The US internet advertising market was roughly $8 billion in 2000 (global digital advertising is now roughly $700 billion) / Growth rate: digital advertising expanded at roughly 20% a year through the 2000s.
Investment: In-house development, funded by roughly $25 million in venture capital raised in 1999.
Outcome: Strong profitability enabled its 2004 IPO and laid the foundation for the growth that followed.
Action 2: Acquiring YouTube and generative AI (Gemini)
Timing: 2006 (acquisition) / 2023 onward (AI)
Context: The emergence of video and AI as new growth frontiers.
Move: Took control of video advertising through the YouTube acquisition and invested massively in generative AI.
Target market size and growth rate: The online video advertising market (YouTube's advertising revenue alone reached roughly $36.1 billion in 2024—more than 20 times the acquisition price) / Growth rate: video advertising is growing at 15–20% a year.
Investment: YouTube acquisition of roughly $1.65 billion (2006); capital expenditure on AI and data centers of roughly $52.5 billion (2024).
Outcome: With AI expectations adding fuel, market capitalization rose from roughly $2.8 trillion to $4.3 trillion between 2025 and 2026.
Microsoft
A US software company. Having built its foundation on Windows and Office, its growth today is driven by cloud (Azure) and AI.
Action 1: Full-scale rollout of the Azure cloud
Timing: 2010 onward
Context: Enterprise IT began its migration to the cloud.
Move: Rolled out an enterprise cloud on top of its Windows and Office base.
Target market size and growth rate: The cloud market was in the tens of billions of dollars in 2010 and is roughly $1.1 trillion today / Growth rate: cloud is growing at roughly 17% a year.
Investment: Microsoft's capital expenditure was roughly $55.7 billion in fiscal 2024 (mostly for cloud and AI data centers).
Outcome: Cloud drove growth, and Microsoft became a $1 trillion company in 2019.
Action 2: Investing in OpenAI and acquiring Activision
Timing: 2019 and 2023
Context: Growth in generative AI and in gaming (subscriptions).
Move: Invested in OpenAI and acquired Activision Blizzard.
Target market size and growth rate: The generative AI market is expanding rapidly toward hundreds of billions of dollars; the global gaming market is roughly $180 billion / Growth rate: generative AI at 30–40% a year, gaming at roughly 8% a year.
Investment: Roughly $11 billion invested in OpenAI, plus roughly $68.7 billion for the Activision acquisition.
Outcome: AI reaccelerated growth, and market capitalization reached $3 trillion in 2024.
Amazon
A US company. Its two pillars are one of the world's largest e-commerce (online retail) businesses and its AWS cloud business.
Action 1: Launching AWS (cloud)
Timing: 2006
Context: An opportunity to offer its own massive infrastructure to outside customers.
Move: Launched the AWS cloud platform, funded with internal capital.
Target market size and growth rate: The cloud market was essentially zero in 2006 and is roughly $1.1 trillion today / Growth rate: cloud is growing at roughly 17% a year.
Investment: Continuous deployment of internal cash (Amazon's capital expenditure has run at around $50 billion a year in recent years).
Outcome: AWS became the company's largest source of profit—a pillar generating more than half of operating income.
Action 2: Acquiring Whole Foods and reinvesting
Timing: 2017
Context: The convergence of e-commerce and physical retail.
Move: Acquired Whole Foods, a fresh-food and brick-and-mortar retailer, while continuing to reinvest in its logistics network.
Target market size and growth rate: US food and grocery retail market of roughly $800 billion / Growth rate: food retail grows slowly at roughly 3% a year (a stable market).
Investment: Acquisition price of roughly $13.7 billion.
Outcome: Market capitalization rose from roughly $1 trillion in 2018 to roughly $2.6 trillion in 2026.
TSMC
A Taiwanese company and the world's largest semiconductor contract manufacturer (foundry). It has no brand of its own, manufacturing chips designed by other companies.
Action 1: Founding as a foundry (contract manufacturer)
Timing: 1987
Context: The conventional wisdom in semiconductors was that design and manufacturing belonged under one roof.
Move: Established a model of focusing solely on manufacturing, without a brand of its own.
Target market size and growth rate: The semiconductor market was roughly $33 billion in 1987 and is roughly $627.6 billion today / Growth rate: semiconductors grow at roughly 8–9% a year over the long term.
Investment: Founding capital of roughly $220 million (with the government providing about 48%).
Outcome: Created the contract manufacturing market and established a position that does not compete with its own customers.
Action 2: Massive capital investment in leading-edge process technology
Timing: 2010s onward
Context: Surging demand for advanced chips for smartphones and AI.
Move: Pulled away from the pack in leading-edge processes with $30–40 billion in annual capital expenditure.
Target market size and growth rate: Semiconductor market of roughly $627.6 billion (of which contract manufacturing accounts for roughly $150 billion) / Growth rate: contract manufacturing (foundry) grows at over 10% a year, accelerating further in the AI era.
Investment: Capital expenditure of $30–40 billion a year.
Outcome: Holds exclusive manufacturing for Apple and NVIDIA, and market capitalization rose from roughly $1 trillion to $2 trillion between 2024 and 2026.
Broadcom
A US semiconductor and infrastructure software company. It has consolidated its businesses through M&A and has surged in recent years on AI semiconductors.
Action 1: Consolidating businesses through M&A (roll-up)
Timing: 2016–2023
Context: A period of consolidation in semiconductors and infrastructure software.
Move: After Avago took on the Broadcom name, it acquired CA, Symantec, and VMware in succession.
Target market size and growth rate: Semiconductor plus infrastructure software markets worth hundreds of billions of dollars / Growth rate: infrastructure software grows at roughly 8–10% a year.
Investment: Total acquisitions of roughly $136 billion (Broadcom $37 billion + CA $19 billion + Symantec $10.7 billion + VMware $69 billion).
Outcome: Consolidated high-margin businesses, and market capitalization rose from roughly $520 billion to $1.9 trillion between 2023 and 2026.
Action 2: Joining the AI semiconductor boom
Timing: 2024 onward
Context: The expansion of AI data centers.
Move: Supplies AI networking and custom semiconductors.
Target market size and growth rate: The market for custom semiconductors and networking for AI data centers is expanding rapidly to tens of billions of dollars a year / Growth rate: expanding rapidly at over 30% a year.
Investment: R&D spending on the order of $9 billion a year.
Outcome: Surged on AI demand, becoming a fixture among companies with market capitalizations above $1 trillion.
Saudi Aramco
Saudi Arabia's state-owned oil company. An energy company with among the world's largest crude oil reserves and production volumes.
Action 1: The largest IPO in history
When: December 2019
Context: Monetizing assets in anticipation of a post-oil future.
Measures: Listed a portion of its shares to raise capital from the markets.
Target market size and growth: Global oil market of roughly $2 trillion a year (crude oil sales) / Growth: demand grows slowly at about 1% a year (prices are cyclical).
Investment: Raised about $25.6 billion in the IPO (the largest in history at the time).
Result: Listed at a market capitalization of roughly $1.7 trillion, becoming one of the world's largest companies.
Action 2: Valuation boost from high oil prices
When: 2022
Context: Oil prices surged amid an energy crisis driven by rebounding demand as economies reopened after COVID-19 and by Russia's invasion of Ukraine.
Measures: Maintained its overwhelming, low-cost crude oil production.
Target market size and growth: Global oil market of roughly $2 trillion a year (expanded in 2022 as oil prices spiked) / Growth: demand grows about 1% a year; in 2022 prices surged roughly 1.5-fold.
Investment: In-house capital expenditure of roughly $40–50 billion a year.
Result: Market capitalization briefly reached about $2.4 trillion, making it the most valuable company in the world.
Meta
A US social media company (formerly Facebook, Inc.). It operates Facebook, Instagram, and WhatsApp, with advertising as its main source of revenue.
Action 1: Acquiring Instagram and WhatsApp
When: 2012 and 2014
Context: The main battleground was shifting to mobile and messaging.
Measures: Acquired and absorbed strong competitors.
Target market size and growth: With the spread of smartphones, mobile social media users grew into the billions / Growth: social media advertising expanded at more than 20% a year through the 2010s.
Investment: About $1 billion for Instagram (2012) and about $19 billion for WhatsApp (2014).
Result: Successfully navigated the shift to mobile and expanded its user base to a dominant position.
Action 2: From metaverse investment to AI and an advertising recovery
When: 2021 onward
Context: After the metaverse hype faded, AI and a recovery in advertising.
Measures: Invested tens of billions of dollars a year in Reality Labs, then shifted its focus to AI and advertising.
Target market size and growth: Social advertising market of about $339 billion (today) / Growth: social advertising grows about 12% a year.
Investment: Cumulative investment in Reality Labs exceeds $60 billion ($10–16 billion a year).
Result: After plunging in 2022 (briefly to about $320 billion), market capitalization recovered to roughly $1.7 trillion in 2024–26.
Tesla
A US electric vehicle (EV) maker. Beyond automobiles, it is expanding into energy storage and autonomous driving.
Action 1: Mass-producing the Model 3 and building Gigafactories
When: 2017 onward
Context: EVs were entering the early stage of mass adoption.
Measures: Established production capacity with the mass-market Model 3 and its Gigafactories.
Target market size and growth: Global automotive market of about $2.75 trillion (EVs held under 1% share at the time) / Growth: autos overall grow about 3% a year, while EVs are surging at 20–30% a year.
Investment: Gigafactory investment of roughly $5 billion per site.
Result: Credited with achieving EV mass production, it reached a $1 trillion market capitalization in October 2021.
Action 2: Expanding into software and energy
When: The 2020s
Context: High expectations for autonomous driving and energy storage.
Measures: Expanded into FSD (autonomous driving) and the energy business.
Target market size and growth: Autonomous driving and energy storage are expected to become markets worth hundreds of billions of dollars / Growth: projected at over 20% a year (the markets are still taking shape).
Investment: Tesla's R&D spending of roughly $4 billion a year.
Result: Sustained the highest market capitalization in the auto industry on the strength of future expectations.
Why these companies grew so fast: the common threads
They captured structures of increasing returns Through network effects, ecosystems, and switching costs, they established "winner-take-all" structures in which the first mover's advantage compounds over time (Arthur, 1989; Parker et al., 2016).
They rode major technology waves Each time the wave changed—PC → internet → smartphone → cloud → AI—the leading players changed with it; today's biggest wave, AI, has lifted NVIDIA, TSMC, and Broadcom (Schumpeter, 1934).
They used M&A for clear, distinct purposes Whether absorbing competitors, acquiring capabilities, or consolidating businesses, the purpose of each acquisition was well defined.
They reinvested their profits They prioritized capital expenditure and R&D over dividends (AWS; TSMC's capex).
They targeted huge, expanding markets In cloud, semiconductors, advertising, and other fields, the growth of the market itself pushed up their market capitalizations. The exception is Aramco, whose position rests on a resource monopoly—a notable contrast.
The 10 fastest-growing nations and regions
A national growth strategy works by choosing which of the country's own industries—among the components of GDP—to expand, and then raising output in those industries through policies of capital allocation (policy finance, tax incentives, state investment, etc.), opportunity creation (regulatory reform, trade and exchange-rate policy, attracting foreign capital, etc.), and institutional design (anti-corruption measures, contract enforcement, fiscal discipline, etc.). In other words, a nation's GDP growth is the outcome of a nation-scale investment decision: which industries (markets) should receive a concentrated allocation of the limited resources of public finance, credit, talent, and foreign capital.
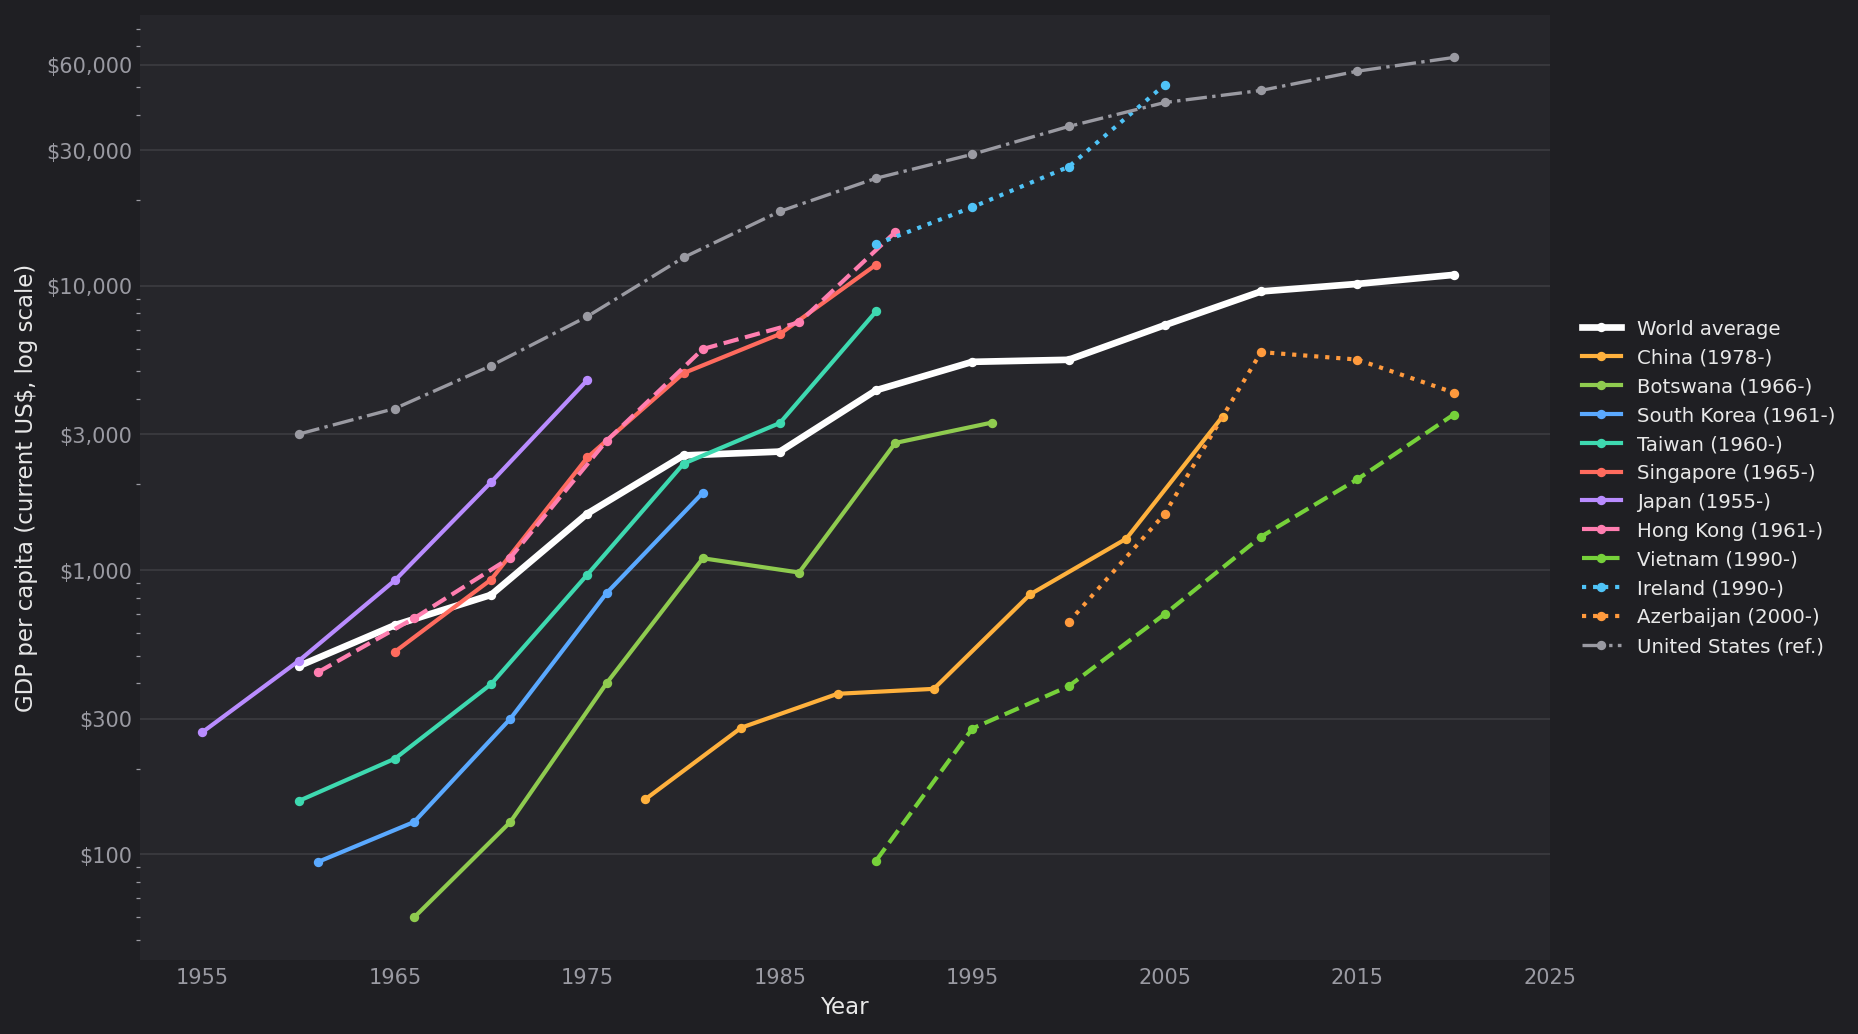
Per capita GDP over time, by country and region
Japan
An island nation in East Asia. Its postwar era of high economic growth made it one of the world's leading economic powers.
Action 1: The Income Doubling Plan
When: 1960
Context: With postwar reconstruction complete, the country was transitioning to full-fledged growth.
Measures: Concentrated public spending on infrastructure (roads, the Shinkansen, ports, electric power) and used low interest rates to steer private capital investment.
Target market size and growth: Expanding export markets such as the global automotive market (about $2.75 trillion today) / Growth: postwar world trade expanded about 8% a year.
Capital allocation, opportunity creation, and institutional design: Capital allocation = more than doubled public investment over 10 years (the Tokaido Shinkansen cost about ¥380 billion at the time, financed in part by a World Bank loan) and steered private capital investment with low interest rates / Opportunity creation = trade liberalization (the liberalization rate rose from about 40% in 1960 to about 93% in 1964) and export promotion / Institutional design = a ten-year "income doubling" target that aligned the expectations of companies and households around growth.
Result: From 1955 to 1973, per capita GDP rose about 15-fold, averaging roughly 10% growth a year.
Hong Kong
A city in southern China (a British colony at the time). As a hub for free trade and finance, it became one of the "Four Asian Tigers."
Action 1: Export-led industrialization through free trade and low taxes
When: 1950s–1970s
Context: Postwar inflows of migrants and capital, plus its position as an entrepôt trade hub during the Cold War.
Measures: Adhered to laissez-faire ("positive non-interventionism") and low taxes, promoting light industries such as textiles, toys, and electronics alongside trade.
Target market size and growth: Global light-industry and trade markets (Hong Kong's exports grew more than 10% a year in the 1960s–70s) / Growth: postwar world trade expanded about 8% a year.
Capital allocation, opportunity creation, and institutional design: Capital allocation = government investment was limited to infrastructure and public housing, with the private sector taking the lead / Opportunity creation = a tariff-free port and a corporate tax rate of around 15% attracted trade and light industry / Institutional design = a British-style legal system and "positive non-interventionism" guaranteed freedom of contract and capital movement.
Result: Real growth of about 7.5% a year from 1961 to 1990; per capita GDP rose roughly 35-fold (nominal) in about 30 years.
Action 2: Transformation into a financial and services hub
When: 1980s–1990s
Context: China's reform and opening-up prompted manufacturing to relocate to the mainland.
Measures: Upgraded the economy toward finance, logistics, and professional services, cementing its position as the gateway to China.
Target market size and growth: Asian financial markets (the Hong Kong stock exchange's market capitalization now stands at several trillion dollars) / Growth: Asian finance and trade expanded at around 10% a year.
Capital allocation, opportunity creation, and institutional design: Capital allocation = led by private capital (the government supplied land and infrastructure) / Opportunity creation = its position as the gateway to a China that had opened up after reform / Institutional design = the US dollar peg (1983, at HK$7.8 to the dollar) and the rule of law secured its credibility as an international financial center.
Result: Became one of Asia's leading international financial centers and joined the ranks of high-income economies.
South Korea
A country in East Asia. Export-led industrialization known as the "Miracle on the Han River" carried it into the ranks of advanced economies.
Action 1: Export-led light industrialization
When: 1962 onward
Context: Starting out as one of the poorest countries in the world.
Measures: The state directed credit preferentially to exporting companies.
Target market size and growth: Global textile and light-industry markets / Growth: world trade expanded about 8% a year in the 1960s.
Capital allocation, opportunity creation, and institutional design: Capital allocation = policy finance channeled preferentially to exporters / Opportunity creation = export promotion and currency devaluation (exports grew from about $40 million in 1961 to about $840 million in 1970) / Institutional design = "export discipline" that tied support to export performance, such as monthly export promotion meetings attended by the president.
Result: Exports surged, laying the foundation for industrialization.
Action 2: The Heavy and Chemical Industry (HCI) Drive
When: 1973
Context: A turning point from light industry toward more advanced industries.
Measures: Concentrated roughly half of all domestic lending on steel, shipbuilding, and electronics as "policy finance" at rates about 5 points below market.
Target market size and growth: Global steel, shipbuilding, and electronics markets / Growth: steel and shipbuilding expanded at around 10% a year during the high-growth era.
Capital allocation, opportunity creation, and institutional design: Capital allocation = about half of domestic lending concentrated on steel, shipbuilding, and electronics as policy finance roughly 5 points below market rates (1973–79) / Opportunity creation = entry licenses granted to the chaebol and access to global heavy-industry markets / Institutional design = discipline that withdrew support from companies that missed their targets, curbing the waste of capital.
Result: The share of heavy and chemical industries in manufacturing rose from 41% to 56%, and per capita GDP grew about 19-fold from 1961 to 1979.
Taiwan
An island in East Asia. It upgraded from export processing to semiconductors and became the center of global semiconductor manufacturing.
Action 1: The Ten Major Construction Projects (infrastructure and heavy industry)
When: 1974–1979
Context: Transition from export processing to industrial upgrading.
Measures: Poured large-scale public spending into infrastructure and heavy industry.
Target market size and growth: Infrastructure and heavy industry (expressways, ports, steelmaking, shipbuilding) / Growth: Taiwan's exports grew about 20% a year in the 1970s.
Capital allocation, opportunity creation, and institutional design: Capital allocation = total investment of over NT$300 billion (equivalent to 10–20% of GDP at the time) in expressways, ports, steelmaking, and shipbuilding / Opportunity creation = export processing zones (Kaohsiung, opened in 1966, was the world's first) connected foreign capital with export markets / Institutional design = consistent execution of long-term plans by the economic bureaucracy (the Ministry of Economic Affairs and the Council for Economic Planning and Development).
Result: Infrastructure was put in place, establishing the foundation for industrial upgrading.
Action 2: Founding TSMC (an early bet on semiconductors)
When: 1987
Context: The dawn of the semiconductor industry.
Measures: Government-led founding of a semiconductor contract manufacturer.
Target market size and growth: The semiconductor market was about $33 billion in 1987 and stands at about $627.6 billion today / Growth: semiconductors grow about 8–9% a year over the long term.
Capital allocation, opportunity creation, and institutional design: Capital allocation = the government contributed about 48% of the roughly $220 million in founding capital / Opportunity creation = spun off technology and talent from the public research institute ITRI to open up the global semiconductor foundry market / Institutional design = development of Hsinchu Science Park (1980) and policies to bring talent back from overseas.
Result: Per capita GDP rose about 53-fold from 1960 to 1990.
Singapore
A city-state in Southeast Asia. As a hub for foreign capital and trade, it developed from a small nation into a high-income country.
Action 1: The EDB and the Jurong Industrial Estate
When: 1961 onward
Context: Newly independent, with high unemployment and scarce resources.
Measures: Concentrated public spending on industrial infrastructure and attracted foreign capital through the English language, a sound legal system, and the eradication of corruption.
Target market size and growth: Global production by multinational corporations (electronics, oil refining) / Growth: overseas production by multinationals expanded at more than 10% a year.
Capital allocation, opportunity creation, and institutional design: Capital allocation = development of the roughly 5,600-hectare Jurong Industrial Estate and equity stakes in government-linked companies (Temasek was founded in 1974) / Opportunity creation = the Economic Development Board (EDB) had attracted more than 1,200 foreign companies and created roughly 93,000 jobs by the late 1970s / Institutional design = English, a British-style legal system, and the Corrupt Practices Investigation Bureau (CPIB), delivering some of the cleanest governance in the world.
Result: GDP per capita rose from $516 in 1965 to roughly $12,000 in 1990 (about 24-fold).
China
A major East Asian power. Since the reform and opening-up of 1978, it has grown rapidly as the "world's factory."
Action 1: Reform and Opening-Up and Special Economic Zones
Period: 1978–1980
Backdrop: A pivot away from a stagnating planned economy.
Measures: Marketization, plus attracting foreign capital through special economic zones such as Shenzhen.
Target market size and growth: Global manufacturing and export markets / Growth: China's exports grew roughly 15% a year from 1980 to 2000.
Capital allocation, opportunity creation, and institutional design: Capital allocation = concentrating fiscal spending and lending on SEZ infrastructure / Opportunity creation = opening the market to foreign capital through special economic zones (expanded from 4 cities, including Shenzhen, to 14), with FDI rising from roughly $57 million in 1980 to about $45 billion a year in 1997–98 / Institutional design = the household responsibility system (dismantling the people's communes) and the Joint Venture Law restored private incentives.
Result: Total GDP grew roughly 27-fold between 1978 and 2000.
Action 2: WTO Accession
Period: 2001
Backdrop: Accelerating globalization.
Measures: Full entry into the global trading system.
Target market size and growth: Global trade (China's exports rose from about $266 billion in 2001 to about $1.58 trillion in 2010) / Growth: China's exports grew roughly 20% a year from 2001 to 2010.
Capital allocation, opportunity creation, and institutional design: Capital allocation = state-owned banks tilted their lending toward export manufacturing and infrastructure / Opportunity creation = WTO accession (2001) lowered tariffs and export barriers, pushing FDI above $50 billion a year / Institutional design = domestic legislation aligned with WTO rules and reform of state-owned enterprises.
Result: Became the "world's factory" and has sustained high growth ever since.
Vietnam
A Southeast Asian nation. Since its market opening (Đổi Mới) in 1986, it has grown rapidly on the back of manufacturing exports.
Action 1: Market Opening through Đổi Mới ("Renovation")
Period: 1986 onward
Backdrop: A planned economy at an impasse and an inflation crisis.
Measures: A sweeping pivot to agricultural decollectivization, price liberalization, and opening to the outside world.
Target market size and growth: Global labor-intensive manufacturing markets (apparel roughly $1.5 trillion, footwear roughly $400 billion, etc.); Vietnam's exports grew from about $2.4 billion in 1990 to about $370 billion in 2022 / Growth: Vietnam's exports have grown 15–20% a year.
Capital allocation, opportunity creation, and institutional design: Capital allocation = reallocating resources from the state sector to private and foreign firms (FDI enterprises now account for roughly 19% of GDP and about 35% of formal employment) / Opportunity creation = transition to a market economy through price liberalization and external opening / Institutional design = land-use rights and an enterprise law that legalized private companies and household farming.
Result: Average annual growth of roughly 6.8% from 1990 to 2019; GDP per capita rose roughly 37-fold (in nominal terms) over 30 years.
Action 2: Integration into Global Supply Chains
Period: 2000s onward
Backdrop: Rising labor costs in China and demand for a destination for relocated production.
Measures: WTO accession (2007), trade agreements, and the attraction of foreign investment turned the country into an export hub for electronics and garments.
Target market size and growth: Global electronics market of over $1 trillion and apparel market of roughly $1.5 trillion / Growth: electronics and apparel exports expanding at more than 10% a year.
Capital allocation, opportunity creation, and institutional design: Capital allocation = FDI inflows of $10–20 billion a year (Samsung alone has invested more than $20 billion cumulatively) / Opportunity creation = WTO accession (2007) and a range of FTAs connected the country to global export markets / Institutional design = industrial parks, tax incentives, and other investment-friendly conditions for foreign firms.
Result: Became a major production base for Samsung and the Apple supply chain, sustaining high growth.
Azerbaijan
An oil-producing country in the Caucasus (a former Soviet republic). Development of its Caspian Sea oil fields gave it the fastest growth in the world in the 2000s.
Action 1: The "Contract of the Century" and the BTC Pipeline
Period: 1994–2006
Backdrop: The post-Soviet scramble for resource development and high oil prices in the 2000s.
Measures: Developed Caspian oil fields through a consortium with foreign companies and secured an export route via the BTC pipeline (an investment of roughly $4 billion).
Target market size and growth: Global oil market of roughly $2 trillion a year / Growth: oil prices roughly quadrupled during the 2000s.
Capital allocation, opportunity creation, and institutional design: Capital allocation = tens of billions of dollars of foreign capital into oil fields and pipelines (the BTC pipeline alone about $4 billion) / Opportunity creation = the "Contract of the Century" (1994) opened development rights to the international oil majors / Institutional design = the State Oil Fund (SOFAZ, 2001) to set aside resource revenues (though dependence on oil persists).
Result: Real GDP growth of roughly 35% in 2006 (the fastest in the world at the time), with growth of 20–35% a year in 2005–07.
Botswana
A landlocked country in southern Africa. Achieved high growth through its diamond resources and sound governance.
Action 1: Channeling Diamond Revenues into a Fund
Period: 1967 onward
Backdrop: Just after independence, one of the poorest countries in the world.
Measures: Developed its diamonds through a joint venture with De Beers (Debswana), pooled the revenues into a fund, and allocated them to infrastructure and education.
Target market size and growth: Global diamond market of roughly $101 billion (Botswana's exports have recently run at about $3.3 billion a year) / Growth: long-term diamond demand grows slowly, at roughly 3% a year.
Capital allocation, opportunity creation, and institutional design: Capital allocation = diamond revenues (roughly 30% of GDP) pooled into a fund and reinvested in infrastructure and education / Opportunity creation = a 50:50 joint venture with De Beers (Debswana) secured bargaining power and sales channels / Institutional design = curbing corruption and maintaining fiscal discipline through national development plans, thereby avoiding the "resource curse."
Result: Real growth of roughly 9% a year from 1966 through the 1980s, among the fastest in the world.
Ireland
An island nation in Europe. Attracted multinationals with low corporate taxes, achieving the high growth that earned it the name "Celtic Tiger."
Action 1: Attracting Foreign Investment with Low Corporate Tax
Period: 1990s onward
Backdrop: Formation of the EU single market and globalization.
Measures: A 12.5% corporate tax rate and IDA-led promotion concentrated the European bases of US IT and pharmaceutical companies in Ireland.
Target market size and growth: Demand from US IT and pharma firms for bases serving the EU single market (population roughly 450 million, GDP roughly $18 trillion) (global pharmaceutical market roughly $1.6 trillion, IT services market roughly $1.5 trillion; foreign-owned firms now directly employ about 300,000 people in Ireland) / Growth: IT and pharma grew roughly 10% a year in the 1990s and 2000s.
Capital allocation, opportunity creation, and institutional design: Capital allocation = public investment in education (free secondary education from 1967, a network of institutes of technology) / Opportunity creation = the 12.5% corporate tax rate and IDA promotion concentrated the European bases of US IT and pharma firms (foreign firms directly employ about 300,000 people) / Institutional design = single-market access through EU membership (1973) and wage agreements between labor and management (social partnership).
Result: GDP per capita rose from about $14,000 in 1990 to about $60,000 in 2007 (roughly 4-fold).
Why Nations Grew So Fast: The Common Threads
Focused allocation of resources Every one of these countries chose a market it intended to "win" and concentrated fiscal spending, credit, and foreign capital on it. The funding came from three types of sources: domestic public finances, external capital (aid and FDI), and resource revenues.
Targeting expanding markets Like the companies and the wealthy individuals, they targeted markets that were small at first but expanding on a global scale (semiconductors, automobiles, manufacturing, IT).
Institutions and the quality of governance were decisive With the same resources, a country grows if it pools and reinvests them (Botswana) but stalls if corruption and waste take over. What "business profitability" is to a company, "quality of governance" is to a nation (Acemoglu & Robinson, 2012). It has also been noted that growth that depends on increased inputs without productivity gains is hard to sustain (Krugman, 1994).
The 10 Fastest-Growing Fortunes
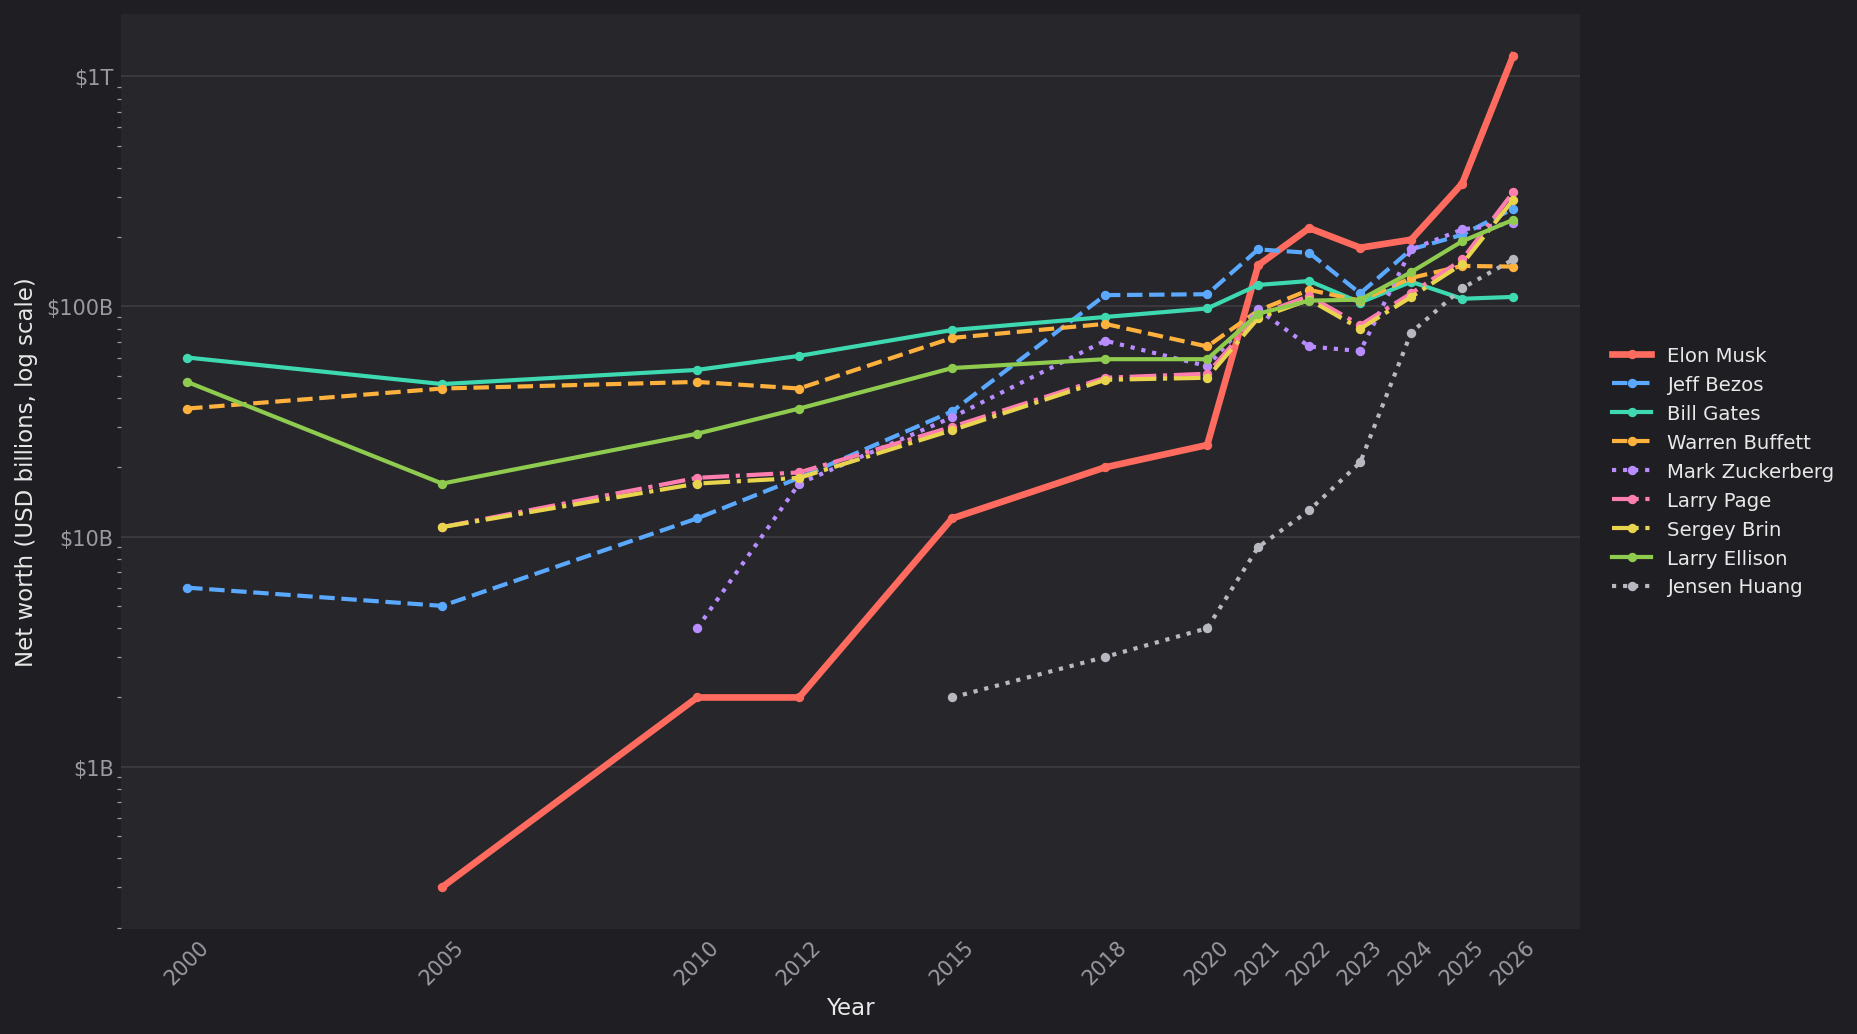
Net worth over time for each individual
Elon Musk
American entrepreneur. Leads EV maker Tesla and space company SpaceX; in 2026 he became the world's first person worth more than $1 trillion.
Action 1: Reinvesting the Entire PayPal Windfall
Period: 2002–2004
Backdrop: The eve of Web 2.0; both EVs and space were still immature.
Measures: Founded X.com, merged it with rival Confinity to form PayPal, which eBay then acquired; poured the roughly $180 million he netted into SpaceX and Tesla.
Target market size and growth: Space roughly $400–600 billion, automotive roughly $2.75 trillion / Growth: space roughly 8% a year, EVs 20–30% a year.
Investment: Roughly $180 million.
Result: His founding stakes in both companies later carried unrealized gains in the hundreds of billions of dollars.
Action 2: SpaceX IPO and xAI Merger
Period: 2026
Backdrop: Simultaneous expansion of AI and space (satellite communications).
Measures: Folded xAI into SpaceX, then took the company public.
Target market size and growth: Space roughly $400–600 billion plus the rapidly expanding AI market / Growth: space roughly 8% a year, AI more than 30%.
Investment: Raised roughly $75 billion in the SpaceX IPO (2026, the largest ever).
Result: His stake (roughly 42%) came to about $760 billion, for a net worth of roughly $1.23 trillion (the world's first above $1 trillion).
Jeff Bezos
American entrepreneur. Founder of Amazon, one of the world's largest e-commerce and cloud companies.
Action 1: Founding Amazon
Period: 1994
Backdrop: The early days of the commercial internet.
Measures: Founded an online bookstore and prioritized reinvestment over profit.
Target market size and growth: E-commerce in its infancy / Growth: e-commerce grew 20–30% a year from the late 1990s through the 2000s.
Investment: His own funds plus about $245,000 from his parents.
Result: IPO in 1997; his net worth reached the hundreds of millions of dollars.
Action 2: Launching AWS (Cloud)
Period: 2006
Backdrop: The rise of cloud computing.
Measures: Sold the company's internal infrastructure to outside customers, turning it into a highly profitable business.
Target market size and growth: The cloud market was near zero in 2006 and is now roughly $1.1 trillion / Growth: cloud grows roughly 17% a year.
Investment: Continuous reinvestment of Amazon's profits rather than paying dividends (capital expenditure has run around $50 billion a year in recent years).
Result: AWS became the profit engine, and in 2018 he became the world's richest person at roughly $112 billion.
Bill Gates
American entrepreneur. Co-founder of software giant Microsoft and, for many years, the world's richest person.
Action 1: Retaining the MS-DOS License
Period: 1980
Backdrop: Just before PCs went mainstream.
Measures: Kept the OS copyright in the IBM deal and supplied the software to other manufacturers as well.
Target market size and growth: The PC operating system market (Windows held over 90% share in the 1990s as PC shipments climbed past 100 million units a year) / Growth: PC shipments grew roughly 20% a year in the 1980s and 1990s.
Investment: About $75,000 to acquire 86-DOS, the basis for MS-DOS.
Result: Windows' dominance made him the world's richest person in 1995.
Action 2: Diversifying Assets through Cascade
Period: 2000s
Backdrop: Avoiding the concentration risk of holding Microsoft stock.
Measures: Sold shares and diversified into blue-chip stocks, railroads, farmland, and real estate.
Target market size and growth: Equity and real-asset markets (railroads, farmland, real estate, etc.) / Growth: long-term returns of around 7–10% a year.
Investment: Tens of billions of dollars in proceeds from Microsoft share sales, spread across a diversified portfolio.
Result: Maintained a net worth of roughly $110 billion even as philanthropy eroded it.
Warren Buffett
American investor. Leads the investment company Berkshire Hathaway and is revered as the "Oracle of Omaha."
Action 1: Acquiring Berkshire and Entering Insurance
Period: 1965–1967
Backdrop: The period in which he put value investing into practice.
Action: Turned the company into an investment vehicle, using the "float" from insurance premiums as interest-free capital to invest.
Target market size and growth rate: US insurance and equity markets / Growth rate: long-run returns on US stocks average roughly 10% a year.
Investment: The insurance float (interest-free investable capital from the acquired insurer National Indemnity) has since grown to roughly $170 billion.
Result of rapid growth: Built a foundation for compounding returns on effectively interest-free leverage.
Action 2: Large-scale purchase of Coca-Cola shares
Period: 1988
Backdrop: Long-term investment in premium consumer brands.
Action: Acquired a large stake in a global brand and held it permanently.
Target market size and growth rate: Global soft-drink market worth several hundred billion dollars / Growth rate: beverages grow steadily at roughly 4–5% a year.
Investment: Roughly $1.3 billion (1988–89); the holding is now worth roughly $28 billion.
Result of rapid growth: The stake multiplied severalfold through long-term holding and became a cornerstone of a fortune of roughly $149 billion.
Mark Zuckerberg
American entrepreneur. Co-founder of social media giant Meta (formerly Facebook).
Action 1: Acquisition of Instagram
Period: 2012
Backdrop: The shift from desktop to mobile.
Action: Acquired a photo-sharing social network to secure a foothold in mobile.
Target market size and growth rate: Mobile photo sharing (Instagram at the time had roughly 30 million users and zero revenue) / Growth rate: mobile social network users were doubling every year at the time.
Investment: Acquisition price of roughly $1 billion.
Result of rapid growth: Successfully navigated the shift to mobile and expanded its user base to a dominant position.
Action 2: Acquisition of WhatsApp
Period: 2014
Backdrop: The rise of messaging.
Action: Absorbed a massive messaging app.
Target market size and growth rate: Social advertising market of roughly $339 billion (today) / Growth rate: social advertising grows at roughly 12% a year.
Investment: Acquisition price of roughly $19 billion.
Result of rapid growth: An expanded advertising base lifted net worth to roughly $230 billion.
Larry Page & Sergey Brin
American entrepreneurs. The two co-founders of search giant Google (now Alphabet).
Action 1: Search-linked advertising (AdWords)
Period: 2000
Backdrop: No established way to monetize search yet existed.
Action: Built a revenue engine on search advertising.
Target market size and growth rate: The US internet advertising market was roughly $8 billion in 2000 → global digital advertising is now roughly $700 billion / Growth rate: digital advertising expanded at roughly 20% a year through the 2000s.
Investment: Roughly $25 million raised from VCs (1999).
Result of rapid growth: High profitability led to a 2004 IPO, turning the founders' shares into vast wealth.
Action 2: Acquisition of YouTube
Period: 2006
Backdrop: Expansion of the video market.
Action: Acquired YouTube to take command of video advertising.
Target market size and growth rate: Online video advertising market (YouTube's ad revenue in 2024 was roughly $36.1 billion) / Growth rate: video advertising grows at 15–20% a year.
Investment: Acquisition price of roughly $1.65 billion.
Result of rapid growth: Each founder's net worth rose to roughly $290–310 billion.
Larry Ellison
American entrepreneur. Co-founder of enterprise software giant Oracle.
Action 1: Founding Oracle
Period: 1977
Backdrop: The emergence of corporate demand for databases.
Action: Commercialized the relational database.
Target market size and growth rate: Enterprise database software (roughly $56 billion) / Growth rate: database software grew more than 15% a year in the 1980s and 1990s and still grows at roughly 10–20% a year.
Investment: Roughly $2,000 in founding capital.
Result of rapid growth: Cornered a piece of core infrastructure that customers find hard to switch away from.
Action 2: Scaling up through acquisitions
Period: 2005–2010
Backdrop: Consolidation of the software industry.
Action: Acquired PeopleSoft, Sun and others.
Target market size and growth rate: Enterprise software market worth tens of billions of dollars (database software now roughly $56 billion) / Growth rate: enterprise software grows at roughly 8% a year.
Investment: Roughly $10.3 billion for PeopleSoft and roughly $7.4 billion for Sun.
Result of rapid growth: Greater scale lifted net worth to roughly $238 billion.
Jensen Huang
Taiwanese-American entrepreneur. Co-founder and CEO of semiconductor giant NVIDIA.
Action 1: Founding NVIDIA and the GPU
Period: 1993
Backdrop: Growing demand for PC graphics.
Action: Developed the GPU and took the company public.
Target market size and growth rate: The PC graphics chip market was worth roughly $3–4 billion in the late 1990s (PC shipments rose from roughly 24 million units in 1990 to roughly 130 million in 2000) / Growth rate: rapid expansion of roughly 20% a year through the 1990s.
Investment: Roughly $20 million raised from VCs.
Result of rapid growth: Established the GPU business.
Action 2: From CUDA to the AI wave
Period: 2006–2023
Backdrop: The rise of deep learning and generative AI.
Action: Opened GPUs to general-purpose computing with CUDA and became the dominant supplier of GPUs for AI.
Target market size and growth rate: Data-center GPU market of roughly $28.5 billion per quarter (2024) / Growth rate: rapid growth of more than 30% a year.
Investment: Sustained R&D spending on CUDA and related areas (now roughly $8.7 billion a year).
Result of rapid growth: The surge in NVIDIA stock lifted net worth to roughly $160 billion.
The overall reasons these fortunes grew so fast
The substance of wealth is founders' equity The source of these fortunes is not salary but the market value of shares in the companies they founded and never stopped holding (Piketty, 2014).
Concentration and long-term holding Rather than diversifying, they staked their capital and time on the business they understood best and held on for the long haul.
Expanding markets and increasing returns They locked in businesses with low replication costs and high barriers to entry (software, platforms, core infrastructure, AI semiconductors), and the growth of those markets pushed their fortunes upward (Arthur, 1989).
Buffett as the exception A contrasting model: instead of creating new markets, he bought existing high-quality companies at a discount and built comparable wealth through insurance float and compounding.
Five companies that failed spectacularly after rapid growth
The very traits that fuel rapid growth—single-minded focus, leverage and bets on expansion—flip into the causes of ruin when the environment changes or when discipline and transparency are lacking.
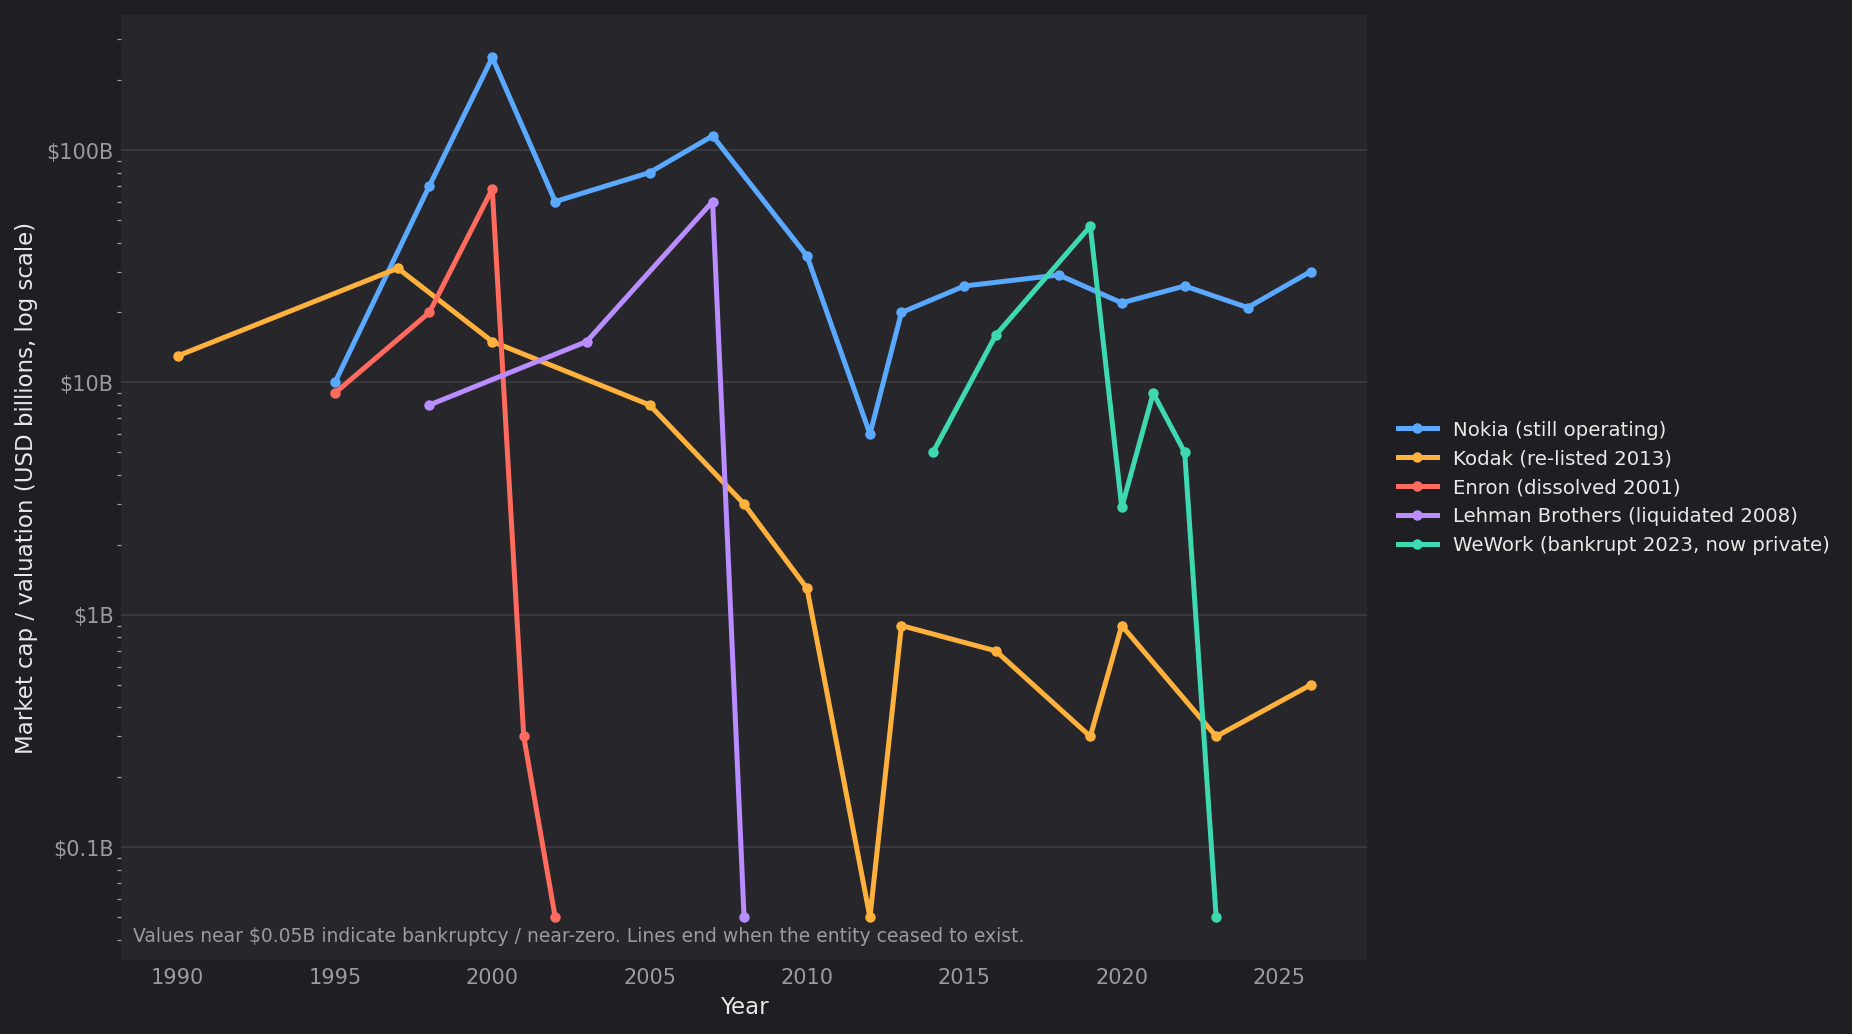
Market capitalization trends of each company
Nokia
Finnish telecommunications equipment company. Once the world's top-selling maker of mobile phones, it fell into decline after missing the shift to smartphones.
Action 1: Slow response to the smartphone wave
Period: 2007–2013
Backdrop: The launch of the iPhone (2007) ushered in the smartphone era.
Action: Clung to its in-house OS (Symbian) and was slow to pivot to touch interfaces and the app economy.
Target market size and growth rate: Worldwide mobile phone sales of roughly 1.1 billion units in 2007 (Nokia's share about 40%) / Growth rate: smartphones surged by more than 50% a year while conventional handsets began to shrink.
Investment: Continued pouring R&D into Symbian and the like (billions of dollars a year), but in the wrong direction.
Outcome of the failure: Market capitalization fell from a peak of roughly €303B (May 2000) to roughly €5B in 2012 (a decline of roughly 98%).
Kodak
American photographic film giant. Invented the digital camera itself, yet failed to adapt to digitization and went bankrupt.
Action 1: Running away from the digitization it had itself invented
Period: 1990s–2012
Backdrop: The digitization of photography.
Action: Despite inventing the world's first digital camera, it held back from a full-scale rollout in order to protect its highly profitable film business.
Target market size and growth rate: US digital camera market of roughly $7 billion (circa 2005); Kodak's share fell from 24% to 7%. Digital grew at roughly 30% a year, while film shrank by 20–30% a year from its peak around 2000
Investment: Prioritized defending film, with its gross margin of roughly 70%, while digital investment remained half-hearted (roughly $500 million poured into the Advantix camera, a film hybrid, ended in failure)
Outcome of the failure: Revenue fell from a peak of roughly $16 billion (1996) to roughly $6 billion at the time of bankruptcy; headcount from a peak of roughly 145,000 to roughly 17,000; filed for Chapter 11 with roughly $6.8 billion in debt; market capitalization went from a peak of roughly $31 billion (1997) to almost nothing
Enron
American energy trading giant. Collapsed when massive accounting fraud came to light, becoming a byword for corporate wrongdoing.
Action 1: Illusory rapid growth built on accounting fraud
Period: 1990s–2001
Backdrop: Deregulation of energy trading.
Action: Hid losses in off-balance-sheet special purpose entities (SPEs) and inflated profits.
Target market size and growth rate: The deregulated US energy trading market (Enron's reported revenue in 2000 was roughly $101 billion, the seventh-largest in the US) / Growth rate: the trading market expanded rapidly (though the profits were fabricated).
Investment: Peak market capitalization of roughly $68 billion; billions of dollars in losses concealed in off-balance-sheet SPEs.
Outcome of the failure: Bankruptcy in December 2001 ($63.4 billion in assets, the largest in US history at the time); the shares became worthless, and its auditor, Arthur Andersen, was dissolved as well.
Lehman Brothers
Major American investment bank. Collapsed in 2008, triggering the global financial crisis.
Action 1: Excessive leverage on subprime
Period: 2003–2008
Backdrop: The housing bubble and the securitization boom.
Action: Piled into mortgage-related securities with high leverage.
Target market size and growth rate: US mortgage securitization market worth trillions of dollars / Growth rate: securitization expanded at roughly 20% a year in the early 2000s → froze in 2007.
Investment: Total assets of roughly $639 billion, with leverage of roughly 30x.
Outcome of the failure: Bankruptcy on September 15, 2008 ($613 billion in liabilities, the largest in US history), triggering the global financial crisis.
WeWork
American shared-office company. Collapsed after a run of overvaluation and overexpansion.
Action 1: Overvaluation and overexpansion
Period: 2019–2023
Backdrop: The unicorn boom of the low-interest-rate era.
Action: Expanded rapidly while still loss-making on a model of long-term leases and short-term subleases, and kept raising enormous sums of money.
Target market size and growth rate: Global office leasing market worth several hundred billion dollars (WeWork at its peak had roughly 770 locations in about 39 countries) / Growth rate: flexible office space grew at roughly 20% a year → contracted sharply with the pandemic.
Investment: Raised more than $10 billion in total from SoftBank and others; peak valuation of roughly $47 billion.
Outcome of the failure: After pulling its IPO in 2019, it filed for bankruptcy in November 2023 ($18.65 billion in liabilities), and the shares became nearly worthless.
The overall reasons these companies failed so badly
Clinging to existing strengths (the innovator's dilemma) The very act of protecting highly profitable existing businesses (film, Symbian) blocked the pivot toward disruptive change (Kodak, Nokia) (Christensen, 1997). The case of Kodak, which had itself invented the digital camera, shows that this was a failure of organizational decision-making, not a lack of technology.
Excessive leverage and overexpansion Expansion built on borrowing or long-term lease obligations flipped instantly into collapse once the environment reversed (Lehman's roughly 30x leverage; WeWork's long-term leases and short-term subleases) (Kindleberger & Aliber, 2005).
Illusory growth through fraud and misconduct Profits with no substance behind them vanished the moment they were exposed, taking the company's entire value with them (Enron's off-balance-sheet SPEs).
Symmetry with the success stories The failed companies took the very same actions as the successful ones—concentrate, expand, ride the wave—and the only difference was whether adaptability, discipline and transparency were present. On the way up, NVIDIA and Enron look exactly alike.
Five countries and regions that failed badly after rapid growth
National failure most often occurs when a country loses discipline over its debt, its currency and its institutions, and the burden falls on its citizens for a long time afterward (Reinhart & Rogoff, 2009).
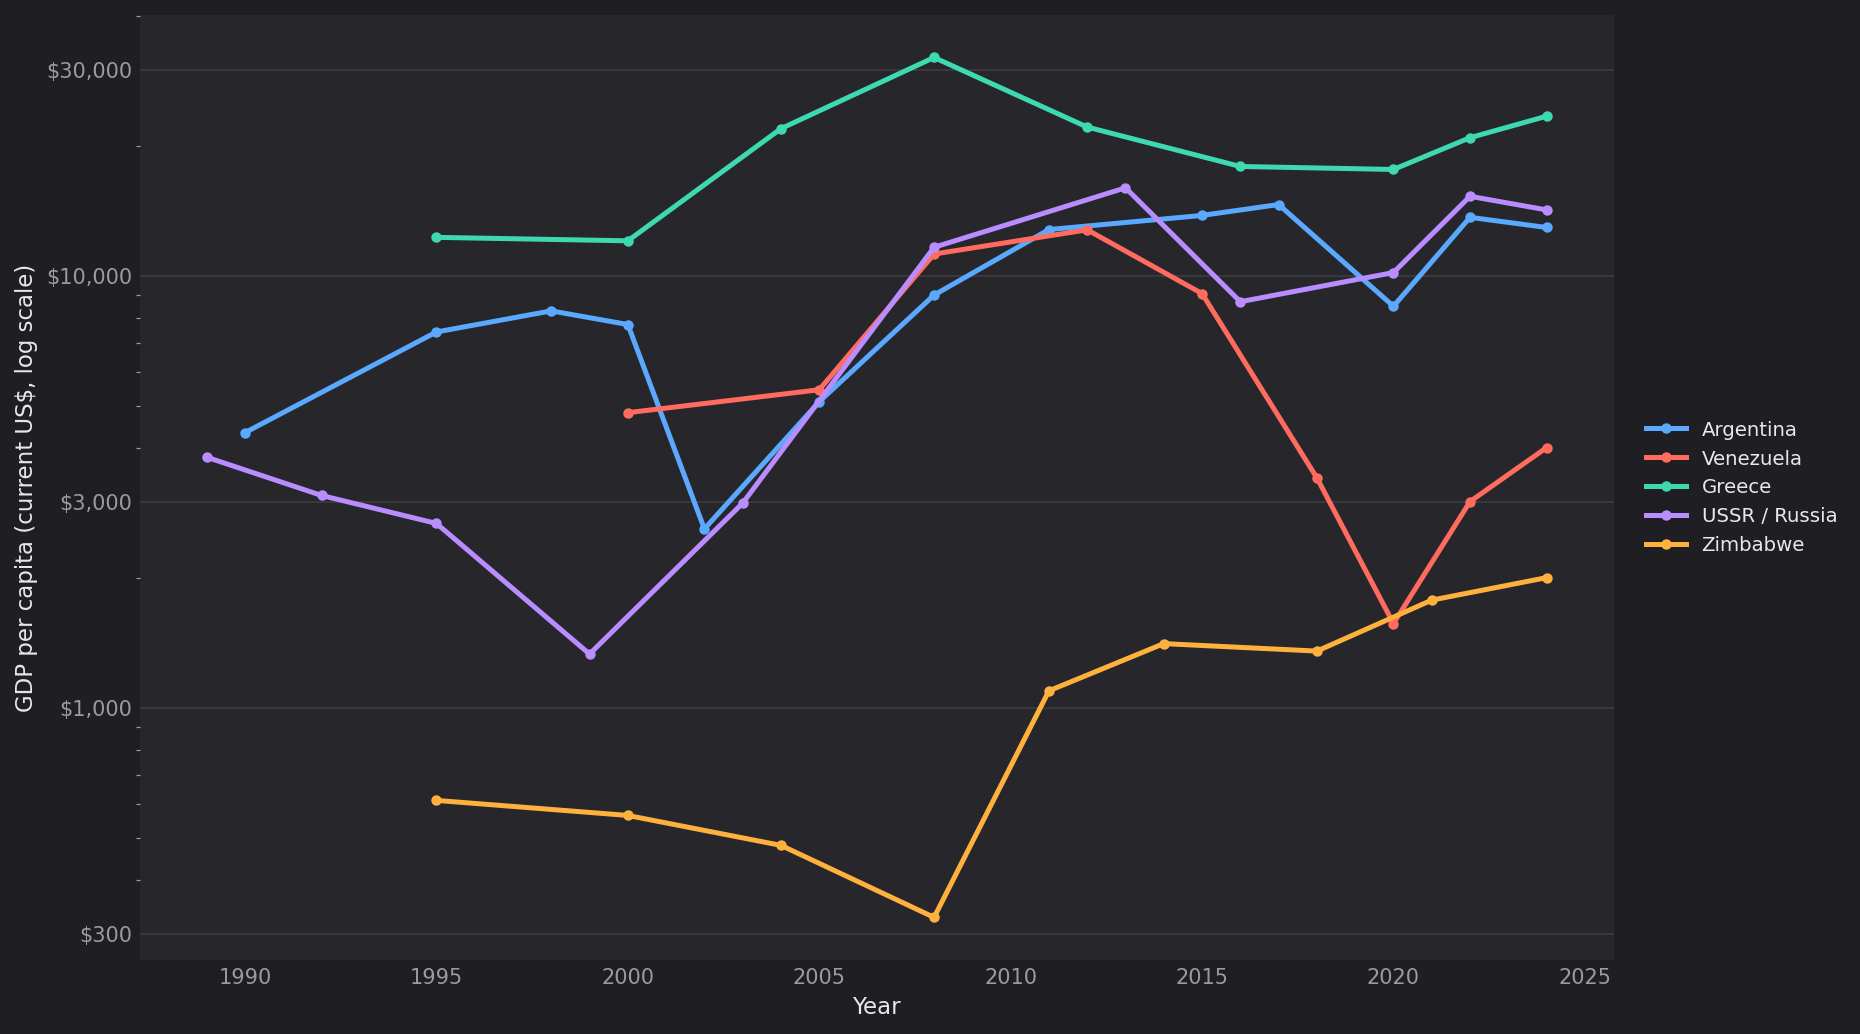
GDP per capita trends for each country
Argentina
A South American nation. One of the world's richest countries in the early 20th century, it sank into prolonged stagnation through a series of debt crises.
Action 1: A fixed exchange rate and ballooning external debt
Period: 1990s–2001
Context: One of the world's wealthiest countries in the early 20th century; a dollar peg brought temporary stability.
Policy: Expanded external borrowing while maintaining a fixed exchange rate against the dollar.
Target market size and growth: Borrowing from international capital markets (public debt exceeding roughly $100 billion, of which about $81.3 billion was defaulted on) / Growth: Capital inflows swelled through the 1990s, then stopped abruptly and reversed in 2001.
Capital allocation, opportunity creation and institutional design (the pattern of failure): Capital allocation = foreign borrowing (public debt of over $100 billion) went to plugging fiscal deficits rather than raising productivity / Opportunity creation = the dollar peg (a fixed rate of 1 peso = 1 dollar) left the currency overvalued and destroyed export competitiveness / Institutional design = a lack of fiscal discipline and a government unable to rein in profligate spending by the provinces (foreign reserves were burned through to defend the peg).
The outcome: GDP fell about 19.9% between 1998 and 2002, and at the end of 2001 the country defaulted on roughly $81.3 billion—the largest sovereign default in history at the time.
Venezuela
An oil-producing South American nation. Oil dependence and misgovernance shrank its GDP by roughly 80% and plunged it into hyperinflation.
Action 1: Oil dependence, handouts and nationalization
Period: 2000s onward
Context: High oil prices under the Chávez government.
Policy: Relied on oil revenue while pushing ahead with the nationalization of companies, price controls and fiscal expansion.
Target market size and growth: Oil accounted for over 90% of exports and brought in tens of billions of dollars in foreign currency a year (in 2014 the oil price crashed from roughly $110 to $50 a barrel) / Growth: The market contracted as oil prices fell about 50% in 2014.
Capital allocation, opportunity creation and institutional design (the pattern of failure): Capital allocation = oil revenue was spent on handouts and subsidies while reinvestment in the state oil company PDVSA was neglected, and output fell from roughly 3 million to 700,000 barrels a day / Opportunity creation = nationalization, price controls and currency controls shut out private and foreign capital / Institutional design = with all three branches of government captured and corruption rampant, every mechanism for imposing discipline disappeared (the polar opposite of Botswana).
The outcome: GDP shrank by about 80%, hyperinflation hit roughly 130,000% in 2018, and some 8 million citizens fled the country.
Greece
A country in southern Europe. Its reliance on borrowing after adopting the euro led to the 2010 debt crisis.
Action 1: Dependence on borrowing after euro adoption
Period: 2000s–2010
Context: Eurozone membership made low-interest financing available.
Policy: Expanded domestic demand on the back of fiscal deficits and external borrowing.
Target market size and growth: The eurozone sovereign bond market (Greek government debt exceeded roughly €300 billion) / Growth: Credit expanded on low interest rates, then the borrowing markets shut in 2010.
Capital allocation, opportunity creation and institutional design (the pattern of failure): Capital allocation = cheap borrowing made possible by euro membership (government debt of over €300 billion) was channeled into consumption spending such as civil-service salaries and pensions, with little invested in export industries / Opportunity creation = by adopting the euro, Greece closed off its own path to restoring competitiveness through devaluation / Institutional design = falsified statistics (under-reporting of the fiscal deficit) and weak tax collection meant discipline never functioned.
The outcome: GDP fell from €242 billion to €179 billion between 2008 and 2014 (a drop of about 26%), and the debt-to-GDP ratio rose from 130% to 180%.
The Soviet Union / Russia
A Eurasian power (the former Soviet Union and its successor state, Russia). The breakdown of its planned economy led to collapse in 1991.
Action 1: The rigidity and collapse of the planned economy
Period: 1970s–1991 (with the 1990s as the transition period)
Context: After a burst of rapid growth driven by postwar heavy industrialization, productivity stagnated.
Policy: Maintained a planned economy devoid of market mechanisms, then attempted a radical transition in its final years.
Target market size and growth: The entire national economy (military spending is estimated at 15–20% of GDP) / Growth: Growth fell from roughly 5% a year in the 1950s to near zero in the 1980s.
Capital allocation, opportunity creation and institutional design (the pattern of failure): Capital allocation = investment was concentrated by plan in the military (15–20% of GDP) and heavy industry, while consumer goods and services suffered chronic shortages / Opportunity creation = with no freedom of prices, trade or enterprise, the country was cut off from world markets / Institutional design = lacking the information carried by market prices and the discipline of competition, there was no mechanism even to measure how much capital was being wasted.
The outcome: The Soviet Union collapsed in 1991; GDP across the former Soviet bloc fell roughly 50% from its 1989 level, and Russia's real GDP shrank by about 30–40% between 1991 and 1998.
Zimbabwe
A country in southern Africa. Land seizures and money printing wrecked its economy, producing one of the worst hyperinflations in history.
Action 1: Land seizures and money printing
Period: 2000s
Context: Forced land reform under the Mugabe government.
Policy: Seized commercial farms, causing agricultural output to collapse, and covered the resulting fiscal deficit by printing money.
Target market size and growth: Agriculture made up roughly 20% of GDP and formed the core of exports (about 4,500 commercial farms were targeted for seizure; tobacco exports of roughly $600 million a year plummeted) / Growth: Agricultural output roughly halved within a few years of the seizures.
Capital allocation, opportunity creation and institutional design (the pattern of failure): Capital allocation = highly productive commercial farms (about 4,500) were seized and redistributed to cronies with no farming expertise / Opportunity creation = the destruction of property rights drove out both foreign and domestic investment / Institutional design = the central bank was stripped of its independence and money printing was used to fund the deficit (inflation reached roughly 89.7 × 10²⁰ percent in 2008).
The outcome: The economy roughly halved between 2000 and 2008, year-on-year hyperinflation reached roughly 89.7 × 10²⁰ percent in 2008, and the national currency collapsed.
Why these nations failed so badly: the common threads
Failed capital allocation Borrowed money and resource revenues were channeled into consumption and patronage rather than productivity-raising investment (Greece's consumption spending, Zimbabwe's redistribution of farms to cronies, Venezuela's handouts). This is the exact opposite of the "fund it and reinvest" approach of successful nations such as Botswana.
Opportunity creation in reverse (severing ties with markets) Through nationalization, the destruction of property rights, overvalued fixed exchange rates and central planning, these countries cut themselves off from private enterprise, foreign capital and export markets (Venezuela, Zimbabwe, Argentina, the Soviet Union).
The collapse of institutions and discipline Collapse began the moment fiscal and monetary discipline and the quality of governance were lost. Falsified statistics (Greece), money printing by a subjugated central bank (Zimbabwe) and defending a fixed exchange rate down to the last dollar of reserves (Argentina) are the textbook cases (Reinhart & Rogoff, 2009; Acemoglu & Robinson, 2012).
The fragility of single dependence Reliance on a single source of income—oil, agriculture or cheap borrowing—proved fatal when prices or capital flows reversed (the resource curse).
The asymmetry of recovery Once the cause of collapse (a fixed exchange rate, money printing, a regime) is removed, a rebound from a low base does occur (Argentina from 2003, Russia from 2000, Zimbabwe's dollarization). But the pre-collapse growth trajectory is not regained for a long time, and the burden continues to fall on ordinary citizens.
Five tycoons who rose fast and then failed spectacularly
A tycoon's downfall comes either when the very "concentration and leverage" that fueled their rise swings against them, or when fraud comes to light.
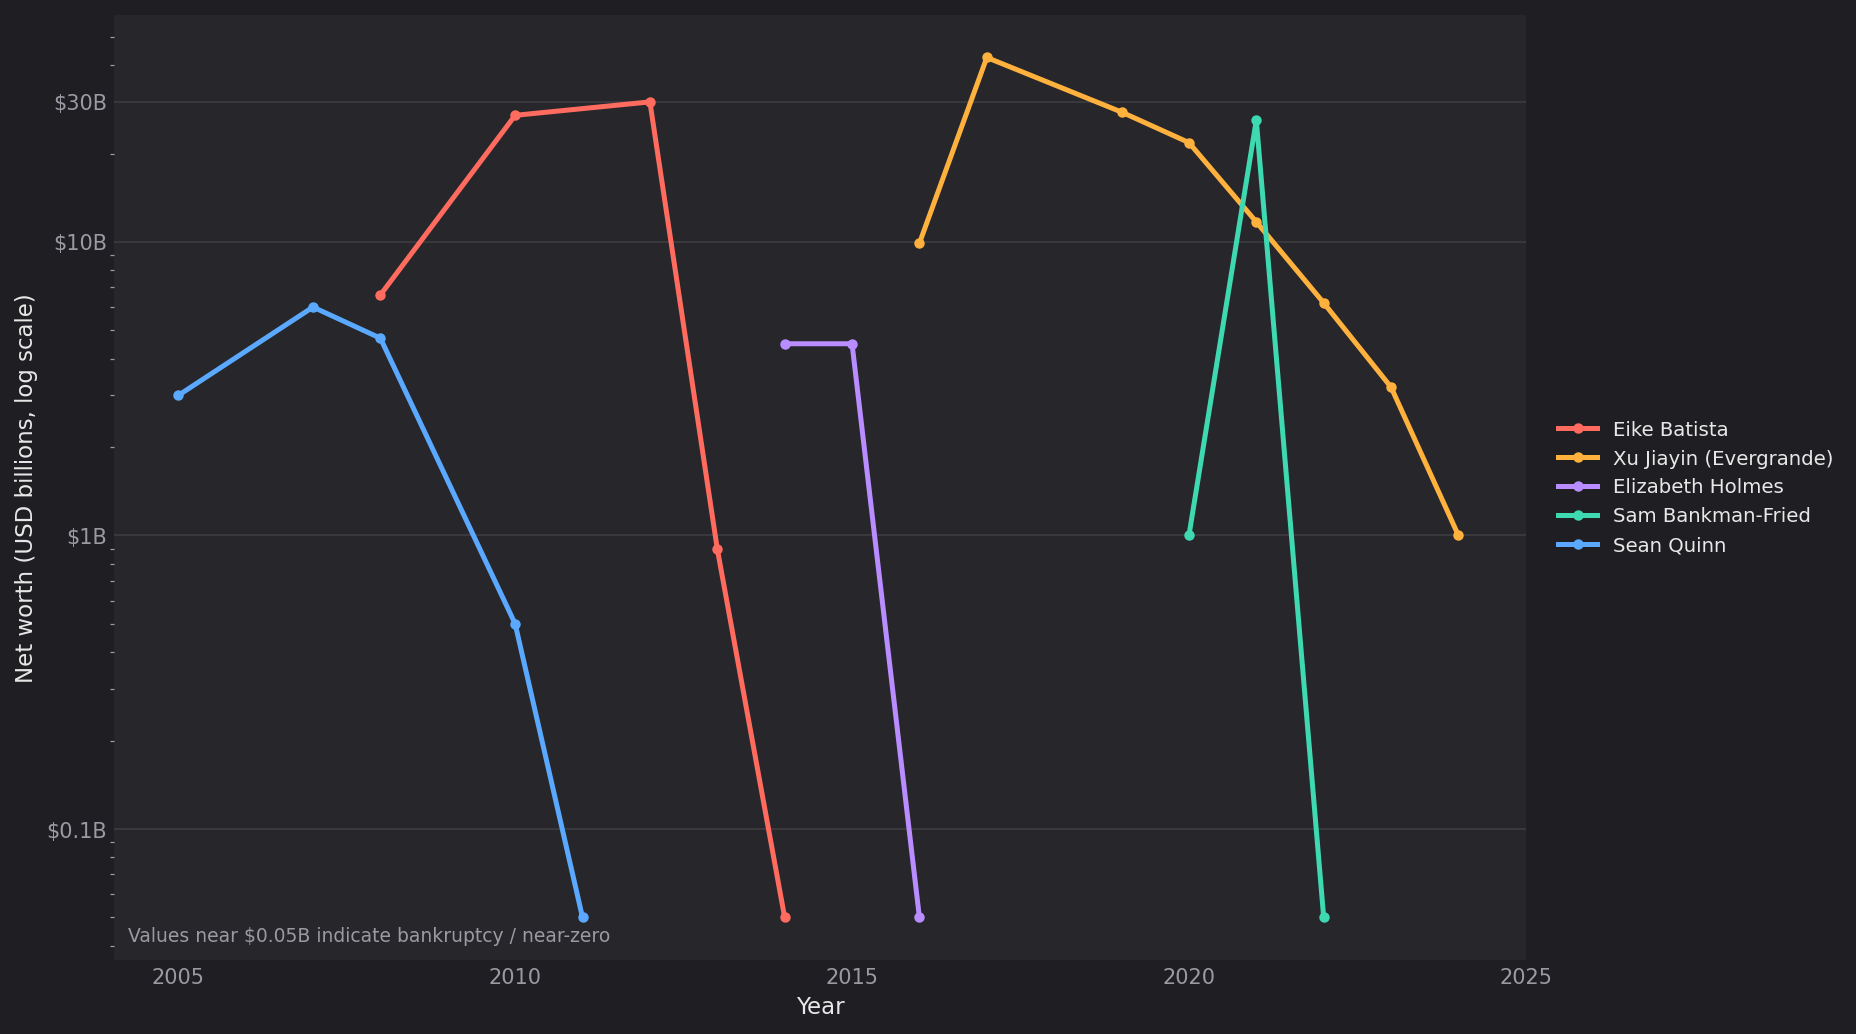
How each tycoon's net worth evolved
Eike Batista
A Brazilian businessman. He became the world's seventh-richest person through natural-resource ventures, then lost his entire fortune within a few years.
Action 1: All-in concentration and leverage on resource ventures
Period: 2007–2014
Context: The commodities boom.
Approach: Concentrated all his capital, plus leverage, in resource businesses such as the oil company OGX.
Target market size and growth: The resource and oil markets during the high-price era (oil hit roughly $140 a barrel in 2008, and iron ore was also near record highs) / Growth: The commodities supercycle (prices multiplied several times over during the 2000s) reversed in 2014.
Investment: Raised billions of dollars by listing five group companies, and poured in his personal wealth as well, amplified by leverage.
The outcome: His fortune, roughly $30 billion in 2012 (seventh in the world), fell to effectively negative by 2014 after OGX missed its production targets and investors pulled out.
Hui Ka Yan (Xu Jiayin)
China's property king. At the helm of Evergrande Group he became China's richest man, before a mountain of debt collapsed and brought him down.
Action 1: Debt-driven property expansion
Period: 2010s–2021
Context: China's property boom.
Approach: Rapidly expanded land acquisition and development on massive borrowings.
Target market size and growth: China's property market, roughly $2 trillion a year at its peak / Growth: About 20% annual growth through the 2000s and 2010s, followed by a 30–50% drop in sales from 2021 onward.
Investment: Liabilities exceeding roughly $300 billion (2.4 trillion yuan).
The outcome: Evergrande defaulted on its dollar bonds in December 2021; his fortune, about $42 billion in 2017 (China's largest), lost more than 90% of its value; a Hong Kong court ordered the company's liquidation in January 2024; and he himself was detained in 2023.
Elizabeth Holmes
An American entrepreneur. She founded the blood-testing company Theranos, but the technology proved to be a sham and she was convicted of fraud.
Action 1: Raising capital on unproven technology
Period: 2003–2018
Context: Silicon Valley's unicorn boom.
Approach: Hyped an unproven technology that promised "every test from a single drop of blood."
Target market size and growth: The US clinical laboratory testing market, roughly $75 billion (the market she envisioned) / Growth: Testing is a stable market growing about 5% a year (but the technology was unproven).
Investment: Raised a cumulative total of more than roughly $900 million from investors.
The outcome: The technology did not work, and a paper fortune of about $4.5 billion went to zero. She was convicted of fraud and sentenced to roughly 11 years in prison.
Sam Bankman-Fried
An American entrepreneur. He founded the crypto exchange FTX, which collapsed after he misappropriated customer funds; he is now serving a prison sentence.
Action 1: Misappropriation of customer funds
Period: 2019–2022
Context: The crypto bubble.
Approach: Diverted customer funds from the FTX exchange to an affiliated fund.
Target market size and growth: The crypto-asset market (peak market capitalization of roughly $3 trillion in 2021) / Growth: Roughly tenfold growth in 2020–21, followed by a drop of about 70% in 2022.
Investment: Misappropriated roughly $8 billion in customer funds.
The outcome: FTX collapsed within days in November 2022, a fortune of about $26 billion went to zero, and in 2024 he was sentenced to 25 years in prison and ordered to forfeit roughly $11 billion.
Sean Quinn
An Irish businessman. Once the richest man in Ireland, he went bankrupt on a bet on a single bank's shares.
Action 1: A highly leveraged bet on a single bank's stock
Period: 2007–2011
Context: Ireland's credit bubble.
Approach: Took a highly leveraged position in Anglo Irish Bank shares through CFDs (contracts for difference).
Target market size and growth: A single stock (Anglo Irish Bank, peak market capitalization of roughly €13 billion) / Growth: The share price fell about 98% in the financial crisis.
Investment: Held the equivalent of roughly 28% of the bank's outstanding shares via CFDs; losses came to about €3.2 billion.
The outcome: The shares collapsed in the financial crisis, taking him from a fortune of about $6 billion in 2008 (Ireland's largest) to bankruptcy in 2011.
Why these tycoons failed so badly: the common threads
Concentration × leverage with repayment deadlines The decisive factor was that they made the same all-in bets as the successful tycoons, but with borrowed money subject to margin calls and repayment deadlines (Quinn's CFDs; the debt dependence of Batista and Hui Ka Yan). The contrast with Buffett's insurance float—capital with no repayment date and no margin calls—shows how much the "quality" of leverage matters.
Reliance on valuations without substance Paper fortunes inflated by unproven technology or fraud vanished the moment the truth came out (Holmes's roughly $4.5 billion, Bankman-Fried's roughly $26 billion).
Buying more at the peak of cyclical markets In markets where prices move in cycles—commodities, property, crypto—they kept expanding right into the peak (Kindleberger & Aliber, 2005). This stands in stark contrast to the successful tycoons, who bet on structurally expanding markets such as cloud computing and AI.
Symmetry with the winners On the way up, winners and losers are indistinguishable. What separated them on the way down was the quality of their leverage (patient capital versus debt subject to margin calls), whether there was a real business underneath, and whether the market was growing structurally or merely cyclically.
What Successes and Failures Share, and Where They Differ
Common Threads and Differences Among High-Growth Companies, Nations and Fortunes
Common threads
Concentrated allocation of scarce resources All of them concentrated limited resources on an expanding market. Companies poured capital and talent into a single business, nations channeled fiscal resources, credit and foreign capital into a single industry, and wealthy individuals concentrated their capital in a single company (Rodrik, 2007; Studwell, 2013).
A bet on an expanding market They targeted markets that were small at first but would later grow to hundreds of billions or even trillions of dollars, and the growth rate of the market itself drove exponential expansion.
Reinvestment and compounding Rather than consuming profits or income, they reinvested them, expanding through compound, exponential growth (Brynjolfsson et al., 2021; Piketty, 2014).
Barriers to entry and long-term holding They built advantages such as network effects, monopoly positions, export competitiveness and location, and sustained them over the long term (Arthur, 1989; Barney, 1991).
Step-change acceleration at turning points Growth was not linear; it leapt in steps at turning points such as founding, IPOs and acquisitions, or reform, opening-up and the creation of special economic zones (Schumpeter, 1934).
Survivorship bias In every case we see only the winners who are successful today, while countless others who made the same bet and failed remain hidden behind them.
Differences
Different objectives Wealthy individuals aim to maximize private wealth, companies to maximize shareholder value, and nations to raise the living standards of their entire population.
Whether diversification is required Companies and individuals can succeed by betting everything on one thing, but nations must diversify, because dependence on a particular industry invites the "resource curse" or the "middle-income trap."
Time horizons Corporate valuations and personal fortunes can soar or collapse within a few years depending on share prices, whereas national GDP moves more gradually and the test is sustaining growth over decades.
The core determinant of success or failure For companies and individuals, the decisive factor is the profitability of the business; for nations, it is the quality of governance and institutions (Acemoglu & Robinson, 2012).
Consequences of risk When a company or an individual fails, the losses fall on shareholders or the individual; when a nation fails, the lives of its entire population are affected.
Metrics Companies are measured by market capitalization, individuals by the value of their shareholdings, and nations by GDP—with the last of these most heavily influenced by prices, exchange rates and population.
Common Threads and Differences Among Companies, Nations and Fortunes That Failed Spectacularly
Common threads
Excessive leverage and all-or-nothing bets Borrowing and concentration on a single target translated directly into ruin when things turned down (Lehman, Quinn, Evergrande, Batista). The very concentration that generated growth becomes the greatest risk when it lacks discipline.
Failure to adapt to a changing environment Clinging to past strengths and existing models prevented them from pivoting in the face of disruptive change (Nokia, Kodak, the Soviet Union) (Christensen, 1997).
Weak governance, lack of transparency and fraud Accounting fraud and misappropriation of customer funds led to collapse (Enron, FTX, Theranos).
Dependence on a single source of revenue Excessive reliance on oil, natural resources, real estate or a single industry proved fatal the moment conditions reversed (Venezuela, Batista, Evergrande).
Overvaluation and overexpansion beyond fundamentals They ballooned on bubble-like expectations and collapsed when fundamentals failed to catch up (WeWork, Greece's dependence on borrowing) (Kindleberger & Aliber, 2005).
Differences
Different patterns of failure Broadly speaking, companies fail through "inability to adapt to disruptive change" or "fraud and overexpansion," nations through "collapse of debt, currency and institutions," and wealthy individuals through "the downside of concentration and leverage" or "fraud."
Different degrees of reversibility A company's or an individual's failure tends to end in bankruptcy and a clean zero, whereas a nation's failure leaves its citizens carrying the burden for years (Venezuela, Zimbabwe).
Different root causes For companies and individuals, the main causes are poor business judgment or fraud; for nations, they are institutional and governance failures combined with a lack of fiscal and monetary discipline (Reinhart & Rogoff, 2009).
Symmetry with success Success and failure are often two sides of the same actions—concentration, leverage and bets on expansion—and what separates them is the presence or absence of discipline, transparency and adaptability. Looking only at the steepness of the climb, you cannot tell winners from losers.
What to Do—and What Not to Do—to Achieve Rapid Growth
What to Do to Achieve Rapid Growth
Identify expanding markets early and build a dominant position Target markets that are small now but will later grow to hundreds of billions or trillions of dollars, and stake out a position ahead of everyone else (Christensen, 1997; Parker et al., 2016).
Reinvest profits and let compounding work Prioritize reinvestment in the business, infrastructure and people over short-term dividends or consumption (Brynjolfsson et al., 2021).
Build barriers to entry Construct advantages that are hard to imitate or switch away from—network effects, proprietary technology, location and institutions (Arthur, 1989; Barney, 1991).
Pivot as the environment changes (be ambidextrous) Protect existing strengths while retaining the flexibility to switch over to disruptive change yourself.
Channel resources and outside capital into productive investment with discipline Place resource revenues and FDI into funds and direct them toward investments that raise productivity (Botswana's success versus Venezuela's failure).
Maintain transparency and governance Keep accounting and cash management sound, and nip any fraud in the bud.
Prepare for the downside and keep an exit option open Secure staged investment and the right to withdraw (real options) so as to avoid a fatal blow.
What Not to Do When Pursuing Rapid Growth
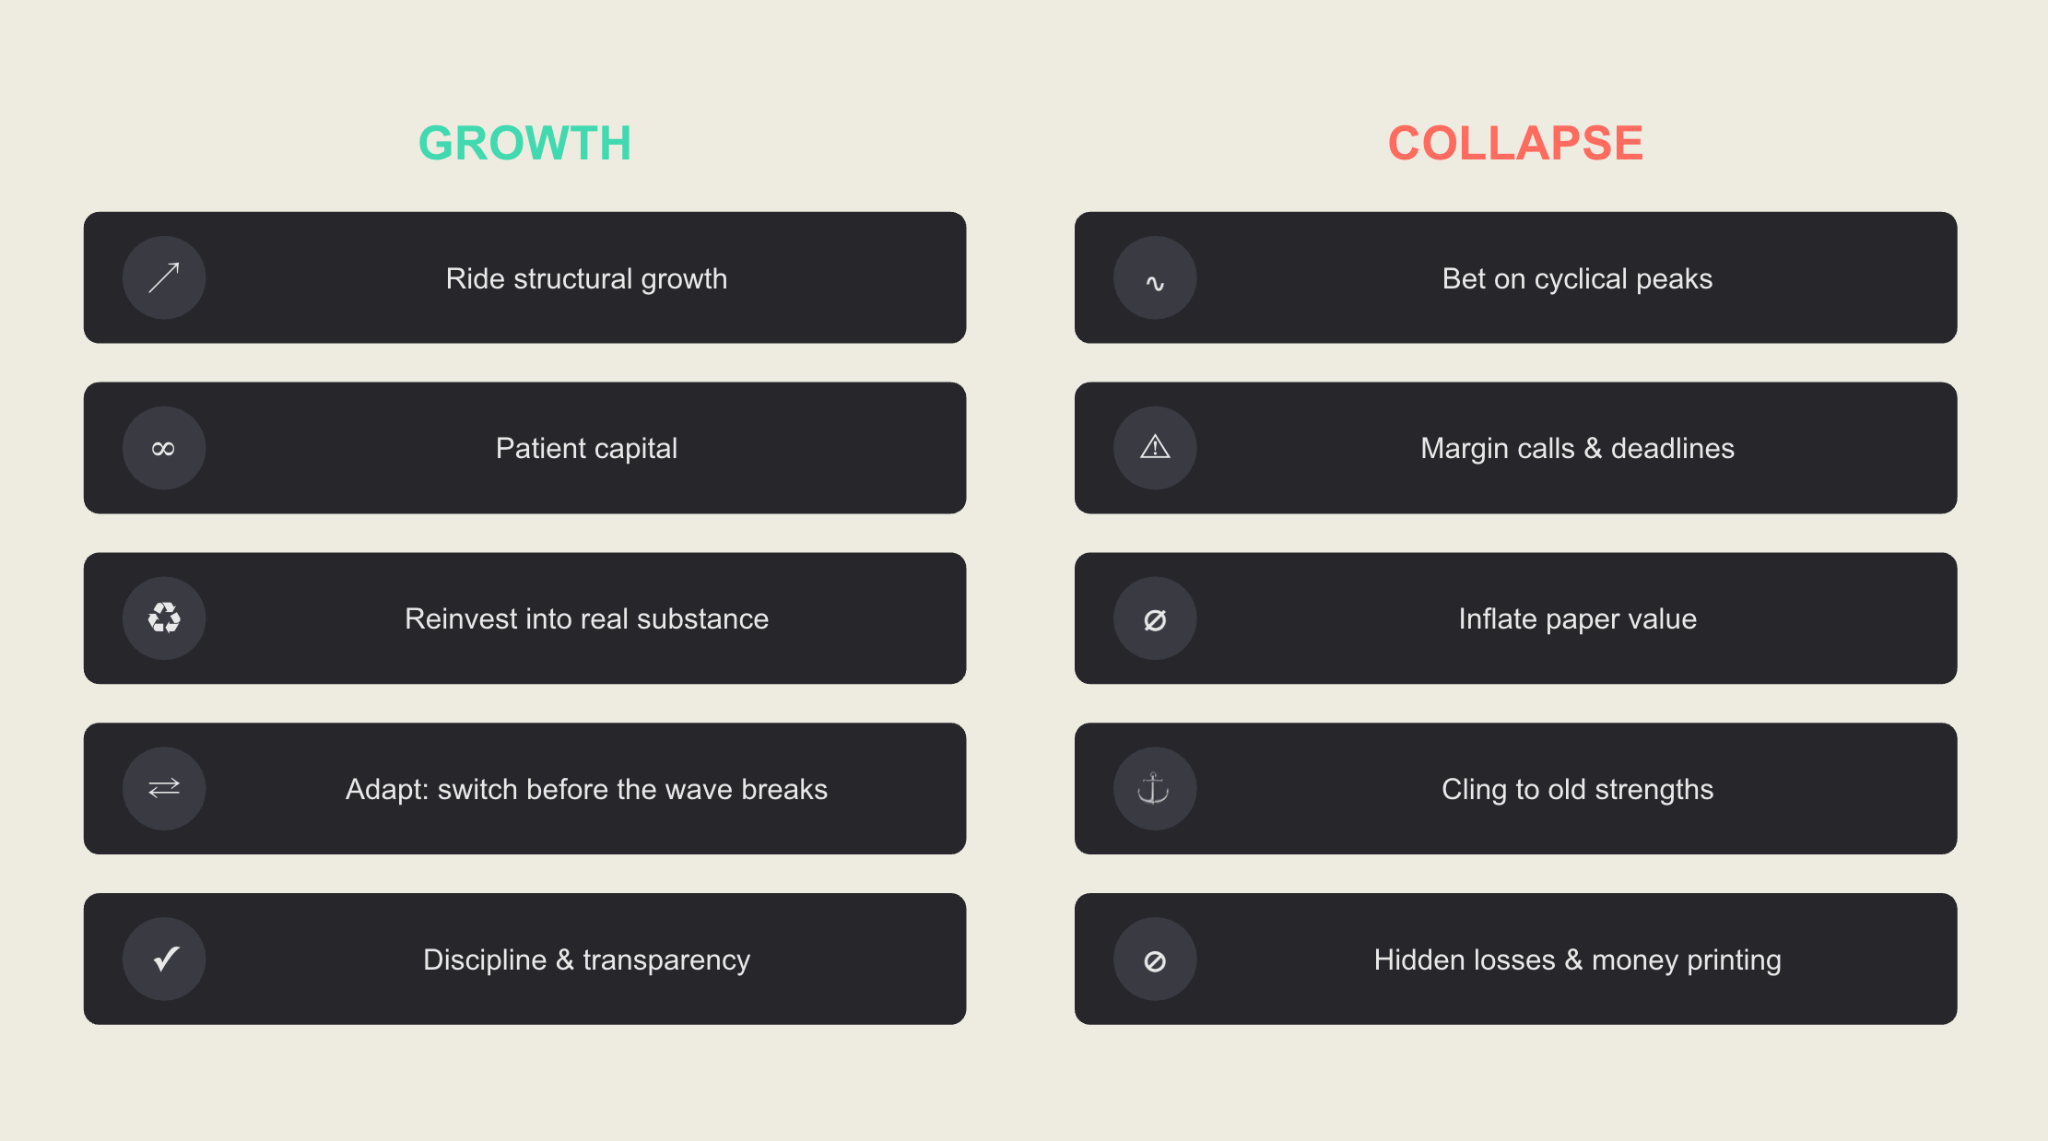
Leverage so excessive it cannot be repaid A downturn brings immediate collapse (Lehman, Quinn).
Betting everything on a single revenue source or a single position Concentration that leaves no room for diversification ends in ruin when conditions reverse (Batista, Evergrande, Venezuela).
Accounting fraud, misconduct and misuse of customer funds They may fake growth for a while, but once exposed, everything is lost (Enron, FTX, Theranos).
Clinging to existing strengths Underestimate disruptive change and you can fall even from the very top (Nokia, Kodak).
Overvaluation and overexpansion without substance Bubbles always correct, and expansion with little behind it collapses (WeWork).
Handing out or squandering resource revenues, and papering over gaps by printing money Lose fiscal and monetary discipline and you invite hyperinflation and currency collapse (Zimbabwe, Venezuela).
Neglecting governance and institutions For nations, growth that lacks quality institutions and governance cannot be sustained (Acemoglu & Robinson, 2012).
The drivers of growth—concentration, leverage and bets on expansion—are double-edged swords. Whether they are paired with discipline, transparency, adaptability and an exit option is what separates great success from great failure.
Conclusion
Whether for a company, a nation or a wealthy individual (entrepreneur or investor), rapid growth comes from where capital is concentrated. To achieve it, we found that thinking carefully about where to concentrate capital matters, but so does—just as much—always having discipline, transparency, adaptability and an exit option in place.
The end
Read next ↓