Research
How to Find Growth Markets: Approaches to Predicting Growth Markets Based on Recent Research
Product
Career
Automatically translated from the Japanese original.
Overview
The companies and nations that have achieved historic bursts of growth invested in growth areas long before most people recognized them. So how do you find a growth market? This article traces the sources of growth to four kinds of change in the external environment—political, economic, social and technological—and organizes forecasting approaches into five families and twelve methods, from S-curves and Wright's law to weak signals, the Delphi method, lead-user research and scenario planning. Drawing on the latest research, it offers a comprehensive overview that covers real-world practice by investors, companies, researchers and governments, research trends since 2020, and the limitations inherent in any attempt to forecast markets.
Introduction
The companies and nations that have achieved historic bursts of growth made bold bets on growth areas well before most people saw them coming. But how does one actually find such growth markets? This article sets out a structured approach to identifying them.
This article contributes three things that are new.
- It organizes the sources of growth into four kinds of change in the external environment, and draws on empirical research to show that these changes steer not only markets but also the direction of research topics and inventions.
- It classifies forecasting methods into five families and maps each to the source of growth it is best suited to detect.
- It summarizes research trends since 2020.
What Drives Growth Markets
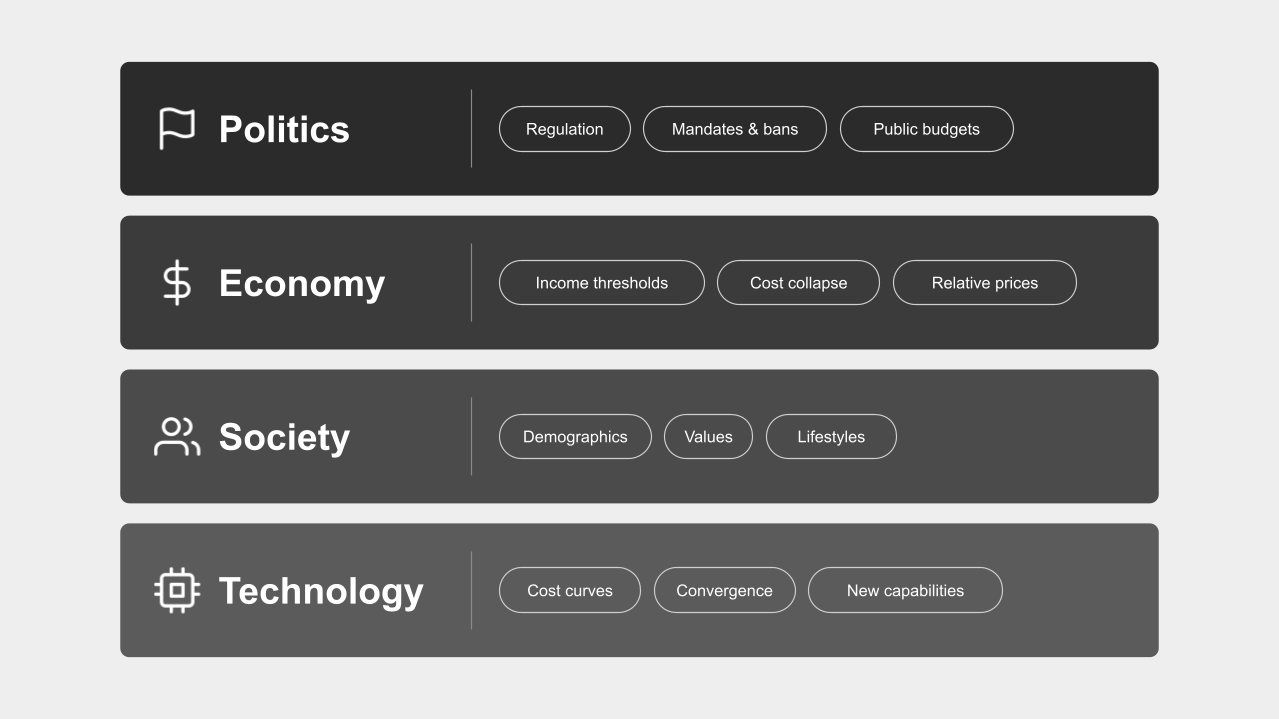
Since the classic works in environmental scanning (the field that analyzes a firm's external environment—politics, economics, society, technology—and applies the findings to management), the sources of growth have been organized into four kinds of change: political, economic, social and technological, or PEST (Aguilar, 1967). The sections below take each in turn.
Political Change
How it affects markets
- Creating and eliminating demand: By mandating or prohibiting particular products and technologies, regulation directly creates demand—and directly destroys it. Well-designed regulation has been argued to spur corporate innovation and open up new markets that incumbents had overlooked (Porter & van der Linde, 1995). Patent data confirm that inventions responding to regulation cluster in the countries and periods where regulation was tightened (Lee, Veloso & Hounshell, 2011)
- Steering research through funding: Public research funding earmarked for specific purposes pulls researchers' attention toward those topics. Data from the US NIH show that when funding for a particular area increases, researchers switch topics and apply for it—evidence that policy moves the direction of research (Myers, 2020)
Examples
- Germany's Renewable Energy Act and the solar market: The Renewable Energy Act (EEG), which took effect in 2000, guaranteed fixed feed-in tariffs for 20 years. It propelled Germany to become the world's largest solar market and triggered investment in mass production of panels around the globe. The law had been under deliberation since the 1990s, so the signs were visible before it was enacted (Jacobsson & Lauber, 2006)
- California's Zero-Emission Vehicle mandate and the EV market: Introduced in 1990, the ZEV regulation required automakers to sell a set share of zero-emission vehicles, and successive tightening steered R&D toward electrification. One of the starting points of the EV market was regulation, not demand (Collantes & Sperling, 2008)
- Emissions standards and the catalytic converter: Tighter emissions standards under the US Clean Air Act increased patent filings for emissions-control technology by automakers and suppliers, in step with the timing of the regulation. It is a case in which regulation determined both when and in what direction invention occurred (Lee, Veloso & Hounshell, 2011)
Economic Change
How it affects markets
- Purchasing-power thresholds: When incomes rise and a product's price falls below what households can afford, a market takes off discontinuously. The expansion of the middle class in emerging economies has been pushing tens of millions of people a year across that threshold (Kharas, 2017)
- Collapsing costs unlocking new uses: As a technology gets cheaper, applications that were "technically possible but too expensive" become economically viable one after another and turn into markets. The rule of thumb that cost falls by a fixed percentage with every doubling of cumulative production has been confirmed across many technologies, and the point where the cost decline crosses the break-even threshold for a given application gives an estimate of when that market will emerge (Nagy et al., 2013; Farmer & Lafond, 2016)
- Relative prices steering invention: When the price of an input rises, invention shifts toward technologies that economize on it. This mechanism, known as "induced innovation," shows that economic signals move the direction of invention (Schmookler, 1966; Popp, 2002)
Examples
- The emerging-market middle class and mobile payments: The world's middle-class population expanded rapidly in the 2010s, with Asia accounting for most of the growth (Kharas, 2017). As people without bank accounts came to own smartphones, markets that had never existed in advanced economies emerged—mobile payments in China and ride-hailing and payment platforms in Southeast Asia
- The collapse in genome sequencing costs and consumer genetic testing: The cost of sequencing one human genome fell from roughly $100 million in 2001 to the low thousands of dollars by the mid-2010s (Wetterstrand, 2023). That collapse turned applications that had only been feasible for research institutions—consumer genetic testing, genomic medicine for cancer, breeding in agriculture and livestock—into markets
- Energy prices and energy-saving patents: Since the oil shocks of the 1970s, rising energy prices have produced statistically significant increases in patent filings for energy-saving technologies. The effect of a price rise appears within a few years, and when prices fall, invention slows down too (Popp, 2002). It is the clearest empirical example of relative price changes moving the direction of invention
Social Change
How it affects markets
- The certainty of demographics: Population dynamics are "the future that has already happened." The number of people born this year all but fixes the number of 20-year-olds two decades from now, which makes it possible to see each age group's demand for consumption, healthcare and housing 10 to 20 years ahead. Of the four sources, this is the most reliable input for forecasting (Drucker, 1997)
- Expected future demand steering invention: The future market size implied by demographics shapes the direction of corporate R&D. It has been causally confirmed that the larger the expected market in a given area, the more new products are developed for it (Acemoglu & Linn, 2004)
- Shifts in values and lifestyles: Changes in values (around the environment, health and how time is spent) and in household structure shift demand from existing product categories to new ones. Unlike demographics, these changes show up late in the statistics, so the only way to catch them early is to observe leading-edge users (von Hippel, 1986)
Examples
- Japan's aging population and the long-term care and healthcare market: The share of Japan's population aged 65 and over rose from 12% in 1990 to 29% in 2020 and is projected to keep climbing (National Institute of Population and Social Security Research, 2023). Against the backdrop of this near-certain shift, a long-term care services market took shape with the introduction of the long-term care insurance system in 2000, and it has since broadened into markets for technology applications such as remote monitoring, medication management and care robots
- Demographics and new drug development: Research has shown that diseases whose future patient numbers can be projected from population trends across US age groups see more new drugs developed and approved. The estimate is that a 1% larger expected market size raises new drug entry by about 4–6%—empirical evidence that expectations of future demand determine the direction of invention (Acemoglu & Linn, 2004)
- Women's rising workforce participation and the time-saving and childcare services market: The expansion of women's employment and career-building in the second half of the 20th century was a structural change dubbed the "quiet revolution" (Goldin, 2006). Through the rise of dual-income households, it lifted markets for services that buy time—childcare, prepared meals and food delivery, housekeeping services—across many countries. It is a case in which demographic change and shifting values overlapped
Technological Change
Of the four sources, this is the one that produces the most discontinuous change, so it receives the most extensive treatment here.
How it affects markets
- Cascades of applications from general-purpose technologies: General-purpose technologies such as the steam engine, electricity and IT do not create value on their own; they spawn countless application areas through chains of complementary innovation (Bresnahan & Trajtenberg, 1995). This cascade is observed again and again in a layered sequence—infrastructure, then platforms, then applications—so once the arrival of a general-purpose technology can be confirmed, a structural forecast follows: the next thing to grow will be its application layer, and the next research topics to open up will be those of that layer (Andreessen, 2011)
- Long time horizons: For a general-purpose technology to show up in productivity, business processes and organizations must be redesigned around it—a complementary reinvention that takes decades. Historically, the lag from invention to diffusion has averaged 45 years, and differences in that lag explain about a quarter of the income gap between countries (Comin & Hobijn, 2010). The five waves of technological revolution since the Industrial Revolution show a common pattern: an installation period, then frenzy and a bubble, then a turning point, then a deployment period (Perez, 2002)
- Cost curves opening markets in sequence: The empirical rule that cost falls by a fixed percentage every time cumulative production doubles (Wright's law) has been confirmed to have strong predictive power in a test across 62 technologies (Wright, 1936; Nagy et al., 2013). Each drop in cost brings a new application past break-even, so markets open up in a staircase pattern
Examples
- Electricity and factory productivity (a lag of about 40 years): Electricity became practical in the 1880s, but it did not show up in factory productivity until the 1920s. The reason is that it took roughly 40 years of complementary reinvention to rebuild factory layouts and work design—originally conceived around the steam engine—around the electric motor (David, 1990). It is the foundational case showing that markets for general-purpose technologies take off not when the technology appears but when complementary assets are in place
- The internet, the cloud and layered application markets: On top of the internet as infrastructure came e-commerce, search and SaaS; on top of the smartphone as a platform came the app economy; on top of the cloud came the API economy—each emerging roughly a decade after the layer beneath it. The 2011 observation that "software is eating the world" translated this layered structure into an investment thesis (Andreessen, 2011)
- From GPUs and deep learning to general-purpose AI and specialized AI agents: In 2009, it was shown that GPUs could speed up deep-learning training by tens of times (Raina, Madhavan & Ng, 2009), and in 2012 a GPU-trained neural network won an image-recognition competition by a wide margin, setting off the deep-learning boom (Krizhevsky, Sutskever & Hinton, 2012). The collapse in the cost of parallel computation made foundation models (general-purpose AI) possible, and a market for specialized AI agents is now opening up as their application layer. NVIDIA's 2006 investment in CUDA was a bet placed at the very top of this chain (Witt, 2025).
- The cost curves of solar and batteries: For roughly 40 years, the cost of solar power has fallen by about 20% with every doubling of cumulative production, and in the 2010s it dropped below the cost of incumbent power sources in many regions (Farmer & Lafond, 2016). Lithium-ion batteries have followed the same law, falling past the threshold at which EVs become economically viable (Ziegler & Trancik, 2021). Anyone extrapolating these cost curves could have estimated when each of these markets would take off more than a decade in advance.
These four kinds of change in the external environment are not independent; they move together. The EV market took off through the multiplication of falling battery costs (technology) × emissions regulation (politics) × decarbonization values (society) × demand from emerging economies (economics). The solar market, likewise, emerged because the cost curve (technology and economics), feed-in tariffs (politics), and environmental norms (society) all pointed in the same direction. When multiple sources align, growth in a domain becomes most certain.
Approaches to Forecasting Growth Markets
Methods for detecting and quantifying the changes that give rise to growth markets can be organized into five families comprising twelve techniques. Below, each technique is described from the same three angles: an overview, the background from which it emerged, and concrete examples.
Extrapolation and modeling methods
This family fits a law to historical data and projects it forward. Where data exist, these are the most quantitative methods available; where they do not, analogous cases are borrowed instead.
S-curves and diffusion theory
- Overview: New technologies spread in a fixed sequence: innovators (2.5%) → early adopters (13.5%) → early majority (34%) → late majority (34%) → laggards (16%). Plotted cumulatively, adoption traces an S-curve. Once penetration reaches 10–20%, the slope of the S-curve can be estimated, allowing the saturation level and the time to reach it to be extrapolated (Rogers, 1962).
- Background: The theory originates in a sociological study that tracked how hybrid seed corn spread among farmers in Iowa in the 1930s. The researchers discovered that adoption dates were roughly normally distributed and that cumulative adoption formed an S-curve (Ryan & Gross, 1943). Economists later reproduced the finding with state-level data and showed that the speed of diffusion was proportional to profitability (Griliches, 1957). Rogers then synthesized more than 500 diffusion studies into a general theory.
- Examples: Household penetration rates in the United States for color television, mobile phones, smartphones, and the internet all trace S-curves. The 1980s US mobile-phone forecast that undershot actual uptake by more than 100-fold went wrong because it extended the gentle early phase of the curve as a straight line (The Economist, 1999). Conversely, fitting an S-curve once penetration had passed 10% would have revealed the saturation level with considerable accuracy (Rogers, 1962; The Economist, 1999).
The Bass model
- Overview: A mathematical model that formalizes the S-curve with two coefficients: the coefficient of innovation p (the propensity to adopt spontaneously in response to advertising or other external information) and the coefficient of imitation q (the propensity to adopt through word of mouth from existing adopters). Next-period adoption can be computed from cumulative adoption to date, and the timing of the peak and the size of the market can be solved for analytically. A meta-analysis of 213 applied studies found an average p of about 0.03 and an average q of about 0.38 (Bass, 1969; Sultan, Farley & Lehmann, 1990).
- Background: In the 1960s, appliance manufacturers planning production of consumer durables such as color televisions needed to forecast peak sales from just a few years of post-launch data. Bass validated the model's fit across eleven product categories, including refrigerators, freezers, and televisions, and demonstrated it by predicting in advance when color-television sales would peak (Bass, 1969).
- Example: Before launching its satellite television service in 1994, DirecTV borrowed coefficients from analogous services such as cable television and used the Bass model to forecast subscriber numbers over five years; the forecast closely matched actual results. It stands as the classic demonstration that the model works even before launch (Bass et al., 2001).
Wright's Law (the experience curve)
- Overview: An empirical rule stating that each doubling of cumulative production reduces unit cost by a fixed percentage (10–30%, depending on the technology). It forecasts the emergence of a market from the cost side rather than the demand side: the point at which the declining cost line crosses the threshold where an application becomes economically viable gives an estimate of when the market will open (Wright, 1936).
- Background: In 1936, the aeronautical engineer Wright found that the labor hours needed to assemble an airframe fell at a constant rate as cumulative output grew. The law was used to plan military aircraft production during the Second World War, and in the 1960s the Boston Consulting Group brought it into corporate strategy as the "experience curve" (Wright, 1936; Boston Consulting Group, 1968). In the 2010s, data on 62 technologies statistically confirmed that this law has greater predictive power than rival forecasting rules (Nagy et al., 2013).
- Examples: Since 1976, the cost of solar photovoltaic modules has fallen by about 20% with every doubling of cumulative production, dropping below the generation cost of thermal power in many regions during the 2010s. Lithium-ion batteries have followed the same law, crossing the threshold at which EVs become economically viable (Farmer & Lafond, 2016; Ziegler & Trancik, 2021). Had the law been extrapolated in 1980, the opening of the solar market in the 2010s could have been predicted.
Reference class forecasting
- Overview: Rather than building up a forecast "from the inside," this method examines the actual outcome distribution of a class of similar precedents (the reference class) and locates the target within that distribution. For new-market forecasts, it borrows diffusion coefficients or years-to-peak from analogous technologies (Kahneman & Tversky, 1979; Flyvbjerg, 2006).
- Background: The psychologists Kahneman and Tversky showed that people become systematically optimistic when they view their own plans from the inside (the planning fallacy) and proposed a corrective procedure based on an outside view (Kahneman & Tversky, 1979). Flyvbjerg, using data on 258 transport infrastructure projects, showed that 90% ran over budget (Flyvbjerg, Holm & Buhl, 2002) and turned the idea into a practical method for deriving adjustment factors from the reference-class distribution. The UK Treasury adopted it as official guidance for public-project appraisal in 2004 (Flyvbjerg, 2006).
- Examples: In sales forecasting for new consumer electronics, forecasts that draw on the diffusion curves of comparable products have been shown to be more accurate than those based on managerial judgment alone (Goodwin, Dyussekeneva & Meeran, 2013). DirecTV's pre-launch forecast, which borrowed coefficients from similar services, is also a form of reference class forecasting (Bass et al., 2001). To estimate the adoption of specialized AI agents, the trajectory of enterprise adoption rates for SaaS and cloud computing would be a natural candidate reference class.
Signal detection methods
This family picks up fragmentary early warnings before the data have taken numerical form.
Weak signals
- Overview: An approach that systematically collects and interprets the fragmentary, ambiguous early indicators (weak signals) that precede major change. It is paired with "graduated response," in which the organization's reaction is escalated step by step as a signal's reliability grows (Ansoff, 1975).
- Background: The trigger was the 1973 oil shock, when the long-range corporate planning then in vogue proved wholly unable to cope with discontinuous change. Ansoff, the founder of strategic management, argued that waiting for complete information means acting too late, so organizations must begin moving at the weak-signal stage (Ansoff, 1975). In the 2000s the idea was formalized as the study of "peripheral vision," cataloguing why organizations miss signals and how to address it (Day & Schoemaker, 2006; Schoemaker & Day, 2009).
- Examples: The toymaker Mattel spent several years overlooking the warning signs that its flagship Barbie line was being eroded by the rival Bratz dolls—shifts in girls' preferences and changes in retail shelf displays—and lost substantial market share as a result. The case is analyzed as one in which the signals existed but the organization had no mechanism to capture them (Day & Schoemaker, 2006). In regulation, by contrast, the introduction, deliberation, and public-comment stages of a bill are textbook weak signals, observable years before a law is enacted.
Patent and bibliometric analysis
- Overview: A method for detecting emerging technologies several years before commercialization, using indicators such as acceleration in patent filings, growth rates in publication counts, structural shifts in citation networks, and convergence across disciplines. In recent years, multiple indicators are fed into machine-learning models for automatic classification (Lee et al., 2018).
- Background: The citation index for scientific papers was proposed in 1955 (Garfield, 1955) and put into practice as the Science Citation Index in the 1960s, making it possible to track scientific trends quantitatively. On the patent side, it was empirically demonstrated that more heavily cited patents carry greater economic value (Hall, Jaffe & Trajtenberg, 2005), turning patent data into a tool for gauging the value and direction of technologies.
- Examples: After the 2012 paper on the genome-editing technology CRISPR-Cas9, related publications and patent filings surged within a few years, well ahead of the 2020 Nobel Prize in Chemistry and the founding of numerous companies. Tracking the bibliometrics would have detected the emergence of the application market years in advance. The same approach also serves researchers, as a tool for finding new fields that are not yet crowded (Foster, Rzhetsky & Evans, 2015).
Collective intelligence and judgment methods
When no data exist and human judgment is the only recourse, this family improves accuracy through how judgments are gathered and how judges are trained.
The Delphi method
- Overview: Experts submit forecasts anonymously; the aggregated results and the reasoning behind them are fed back to the group, which then answers again. The cycle is repeated several times until opinions converge. Anonymity prevents participants from deferring to the loudest voice in the room, and the iterations spread information across the group (Dalkey & Helmer, 1963). The name comes from Delphi, the ancient Greek site of the Temple of Apollo and its oracle: just as people once sought the oracle's guidance before momentous decisions of state, the method pools the knowledge and forecasts of many experts to anticipate, and decide on, the future.
- Origins: The method was developed in the 1950s, during the Cold War, by the RAND Corporation for the US Air Force. It was needed to aggregate expert judgment on military questions for which no data existed (for example, how many atomic bombs a Soviet attack would need in order to cut US munitions output by a given amount). Conventional meetings had a well-known flaw: opinions drifted toward whoever held authority or talked the most. Anonymous, iterative rounds eliminated that problem (Dalkey & Helmer, 1963). A later review of the empirical evidence found that Delphi groups outperformed groups whose judgments were merely aggregated statistically in 12 of 16 studies, and outperformed ordinary face-to-face groups in 5 of 5 (Rowe & Wright, 1999)
- Example: Since 1971, Japan's national science and technology foresight survey has used the Delphi method roughly every five years, asking thousands of experts when future technologies are likely to be realized. The 11th survey covered around 700 science and technology topics. Spanning half a century, it is the longest-running Delphi study in the world (National Institute of Science and Technology Policy, 2019)
Prediction markets
- Overview: Forecasts such as "X will happen by year Y" are traded as securities, and the resulting price is read as an estimate of probability. The method borrows a core function of markets—the way they pull dispersed information together into a price—and applies it to forecasting (Wolfers & Zitzewitz, 2004)
- Origins: The insight that prices aggregate scattered knowledge is a classic of economics (Hayek, 1945). The approach drew wide attention in 1988, when the University of Iowa opened a prediction market for the US presidential election and forecast vote shares more accurately than opinion polls (Forsythe et al., 1992). Corporate applications began in the 2000s, and economists went on to advocate using prediction markets in policymaking (Arrow et al., 2008)
- Example: Hewlett-Packard ran an internal market in which employees forecast printer sales; in six of eight cases, it produced more accurate results than the company's official sales forecasts (Chen & Plott, 2002). An analysis of internal prediction markets at Google and Ford likewise found that prices functioned as broadly well-calibrated probabilities and helped correct the optimism bias built into official corporate forecasts (Cowgill & Zitzewitz, 2015)
Superforecasting
- Overview: Superforecasting treats forecasting as a trainable skill and improves accuracy through a defined procedure: (1) break a big question down into smaller, answerable ones; (2) start from the base rate (how often similar cases have occurred in the past) and then adjust for the specifics; (3) express probabilities in fine increments and update them in small steps as new information arrives; (4) deliberate in teams; and (5) keep score and review performance (Tetlock & Gardner, 2015)
- Origins: A 20-year study had concluded that expert forecasts were about as accurate as a chimpanzee's (Tetlock, 2005). In response, IARPA, the US intelligence community's research agency, ran a four-year geopolitical forecasting tournament starting in 2011, pitting multiple research teams against one another. Tetlock's team trained ordinary volunteers, selected the top 2% as "superforecasters," and organized them into teams—and beat the other teams by a wide margin (Mellers et al., 2014)
- Example: A question like "Will specialized AI agents be deployed at X% of mid-sized companies five years from now?" cannot be answered as it stands. The superforecasting procedure decomposes it into parts: (a) the base rate—what adoption rate comparable technologies (SaaS, RPA) reached among companies within five years; (b) how many years it will take for the preconditions for adoption (mature APIs, regulation, pricing) to fall into place; and (c) how leading indicators (announced pilot deployments, job postings) are trending. A probability is assigned to each and the pieces are combined. Simply starting from the base rate has been shown to beat expert intuition (Tetlock & Gardner, 2015)
Demand-side discovery methods
This family uncovers demand that has not yet surfaced in market research by observing people directly.
The lead user method
- Overview: Lead users are people at the leading edge who run into a problem years before the average user does and, finding no existing product that solves it, build their own solutions. The method seeks out these users and reads the future market from what they have built. The key is to look beyond your own market, in adjacent fields where similar problems appear in more extreme form (von Hippel, 1986)
- Origins: The method traces back to a finding in the field of scientific instruments: 77% of important innovations had come not from manufacturers but from users—the researchers themselves (von Hippel, 1976). Von Hippel reasoned that manufacturers fail to spot new demand when they survey average users because those users have not yet encountered the problem, and in 1986 he formalized an approach of learning directly from users at the leading edge (von Hippel, 1986)
- Example: Tackling the problem of preventing infection during surgery, 3M's medical division looked not to its own customers, surgeons, but to lead users who faced the same problem under more extreme conditions: veterinarians (patients covered in fur), Hollywood makeup artists (keeping a film adhered to skin for hours on end), and surgeons in developing countries (infection control without proper facilities). From them it derived concepts for new infection-prevention products (von Hippel, Thomke & Sonnack, 1999). Ideas generated through the lead user method showed roughly eight times the sales potential of those from conventional methods (Lilien et al., 2002)
Jobs to be done theory
- Overview: Customers do not so much buy products as "hire" them to get a "job" done. This method redefines the market around those jobs rather than around existing product categories or customer demographics. Seen through the lens of jobs, both the size of the market and the set of competitors change (Christensen et al., 2016)
- Origins: Christensen developed the theory in the course of his research on disruptive innovation, building on an old marketing insight—"people don't want a drill, they want a hole" (Levitt, 1983). It grew out of his analysis of a recurring failure: incumbents overlook new demand because they segment markets by customer attributes such as age and income (Christensen, 1997; Christensen et al., 2016)
- Example: A fast-food chain trying to boost milkshake sales got nowhere by improving flavor and price. Observation revealed that many morning buyers were hiring the milkshake for a job: to relieve the boredom of a long commute and keep hunger at bay until lunch. For that job, the competition was bananas and donuts—and the relevant market to size was not the "dessert market" but the "commute market" (Christensen et al., 2016)
Structural and scenario methods
When uncertainty is so high that any single forecast is meaningless, this family prepares for the future by mapping out several of them.
Scenario planning
- Overview: Rather than committing to a single forecast, scenario planning separates the near-certainties (demographics, for instance) from the critical uncertainties (regulation, technological breakthroughs, and the like), combines the uncertainties into two to four internally consistent pictures of the future, and monitors leading indicators for each. The goal is not to be right but to prepare decisions that will hold up whichever scenario arrives (Schoemaker, 1995)
- Origins: In the 1950s and 60s, Herman Kahn of the RAND Corporation developed a technique for describing the course of a nuclear war as multiple scenarios (Kahn & Wiener, 1967). Shell brought the approach into corporate management: in the early 1970s it presented its executives with a scenario in which oil prices surged and producer nations seized the initiative, and when the 1973 oil shock hit, Shell responded faster than its rivals. Pierre Wack, who led the work, wrote up the experience in a 1985 paper (Wack, 1985)
- Example: In the 1980s Shell again mapped out scenarios—this time involving a change of regime in the Soviet Union and a sharp fall in oil prices—and is said to have been prepared for the crude price collapse of 1986 (Schwartz, 1991). Applied to forecasting growth markets, in the case of specialized AI agents one might draw four scenarios along two axes—the strength of AI regulation (strong/weak) and the pace of cost declines in foundation models (fast/slow)—make explicit how the application areas and their timing differ in each, and then track the progress of regulatory deliberations and the trajectory of inference costs as leading indicators (Schoemaker, 1995)
Matching methods to sources
Mapping the five families of methods onto the four sources of change from the previous chapter makes clear where each is best applied.
- Political change: Structural and scenario methods (build a scenario for each possible branch in regulation and budgets, and monitor leading indicators)
- Economic change: Extrapolation and modeling methods (cost curves, relative prices, macroeconomic indicators)
- Social change: Extrapolation and modeling methods (demographics) + demand-side discovery methods (shifts in values)
- Technological change: Signal detection methods + extrapolation and modeling methods (patents and papers → S-curves and cost curves)
Examples from practitioners
Outside academia, too, the best researchers, investors, companies, and governments practice methods that mirror the approaches described above. This section lays out, category by category, the techniques and behaviors they use to anticipate growth markets.
Investors
Investors are the players who convert forecasts of growth markets into returns most directly. That said, time horizons and methods differ greatly between venture capitalists, growth-stock investors, hedge funds, and institutional investors.
- Venture capital (Sequoia Capital): Don Valentine, an early investor in Apple, Cisco, and Google, made market size his first criterion for any investment. "I invest in big markets, not in people," he said, repeatedly arguing that even an outstanding management team cannot build a large company in a small market (Valentine, 2010)
- Venture capital (Y Combinator, Andreessen Horowitz, Founders Fund): Y Combinator's Paul Graham advises founders to "live in the future, then build what's missing," on the view that the frustrations felt by people living at the technological frontier are tomorrow's markets. It is the lead user method in practice (Graham, 2012). Andreessen Horowitz's thesis that "software is eating the world" translates the theory of general-purpose technologies into an investment thesis; the firm formulates and publishes specific theses (cloud, mobile, AI) up front and then invests along those lines, a practical version of the structural and scenario-based approaches (Andreessen, 2011). Founders Fund's Peter Thiel asks, "What important truth do very few people agree with you on?", a question that captures the point that excess returns come only from forecasts that depart from the consensus (Thiel & Masters, 2014)
- Long-term growth investors (Baillie Gifford): The Scottish asset manager Baillie Gifford invested in Amazon and Tesla early in their lives as public companies and held them for more than a decade. The rationale is empirical research showing that equity returns are extremely skewed. An analysis of U.S. stocks since 1926 found that all of the net wealth creation came from the top 4% of stocks, while the remaining 96% delivered returns no better than Treasury bills (Bessembinder, 2018). Rather than forecasting the market as a whole, the strategy is to identify the handful of companies that could become dominant winners in a growth market, concentrate in them, and hold for the long term, a strategy derived directly from this distribution
- Thematic active management (ARK Invest): ARK Invest has published a methodology that explicitly applies Wright's Law (costs fall by a fixed percentage with every doubling of cumulative production) to extrapolate the cost curves of technologies such as batteries, genome sequencing and AI, forecast when their application markets will take off, and invest accordingly (ARK Invest, 2024). It is a case of this article's extrapolation and modeling approaches being applied directly to asset management, but the steep decline in its assets under management after the 2021 peak also illustrates a limit: even when the direction of a technology is called correctly, getting the entry price and timing wrong still produces losses (Perez, 2002; Siegel, 2005)
- Macro hedge funds (Bridgewater Associates): Bridgewater, led by Ray Dalio, systematically catalogs several hundred years of debt crises, currency crises and shifts in hegemony, and judges the present by asking which past episode it most resembles (Dalio, 2018). This is reference class forecasting applied to financial markets. George Soros, by contrast, theorized "reflexivity," the idea that market participants' expectations move prices and prices in turn move fundamentals, and placed the self-referential limit of forecasting, the fact that a forecast changes the thing it forecasts, at the center of his investment strategy (Soros, 1987). It is a case of turning the limits of forecasting themselves into a source of profit
- Quantitative hedge funds (Renaissance Technologies): Renaissance Technologies, founded by the mathematician James Simons, makes no forecasts at all about market growth or the future of companies. It confines itself to trades that capture statistical patterns in price data over short horizons (within a few days), and has sustained high performance precisely by abandoning long-term prediction (Zuckerman, 2019). It represents a recognition of the limits of forecasting from the opposite direction to this article: separate what can be predicted (short-term statistical regularities) from what cannot (the long-term direction of markets), and bet only on the former
- Value investors (Berkshire Hathaway): Warren Buffett has deliberately avoided investing on the basis of growth market forecasts. In his 2007 letter to shareholders he wrote that "the worst sort of business is one that grows rapidly, requires significant capital to engender the growth, and then earns little or no money. Think airlines" (Buffett, 2008). His policy decouples market growth from investment returns and selects only companies with durable competitive advantages within the range of what he can understand (his circle of competence). It is a case of building an investment philosophy on two limits: the difficulty of picking growth markets, and the fact that growth does not necessarily translate into profit
- Institutional investors (Temasek, Yale endowment): Singapore's state-owned investment company Temasek has identified four structural trends ("digitisation," "sustainable living," "future of consumption" and "longer lifespans") and is reshaping its portfolio around them (Temasek, 2023). It is this article's four sources of growth (technology, society, economy and demographics) translated into an institutional investor's asset allocation. David Swensen, who ran the Yale endowment, shifted its allocation from the 1980s onward toward asset classes such as venture capital and private equity, where information asymmetries are large and forecasting skill is rewarded, transforming the endowment management model (Swensen, 2009). His choice was not only "which markets will grow" but "in which markets does the skill of identifying winners translate into excess returns"
- What empirical research says about investor judgment: In a survey of 885 VCs, the factor they weighted most heavily in selecting investments was the management team, followed by the market and the business model (Gompers et al., 2020). In an ex-post analysis of more than 200 companies, however, timing was the factor that best explained success (Gross, 2015). VC returns follow an extremely skewed distribution in which a few big wins carry the whole portfolio (Kerr, Nanda & Rhodes-Kropf, 2014), and public equities are skewed in the same way (Bessembinder, 2018). Identifying markets therefore functions not only as a question of "which deal to invest in" but as a question of portfolio design: in which domains to spread many small bets, and how to concentrate on the winners. In actively managed public equities, only a tiny minority of managers beat the market average after fees (Fama & French, 2010), and the correlation between a country's economic growth rate and its equity returns is roughly zero or negative (Ritter, 2005). Being able to forecast a growth market and turning that forecast into investment returns are, empirically, two separate problems
Companies
- Amazon (Working Backwards, AWS): "Working Backwards," in which the press release for a future product is written first and development is reverse-engineered from customer value, is demand-side exploration turned into an institution. Using this method in the early 2000s, Amazon read its own infrastructure operations problems as a signal that other companies must have the same problems, and launched the AWS cloud service in 2006. It is a case of discovering an external market through the problems of internal lead users (the company's own development teams) (Bryar & Carr, 2021)
- NVIDIA (CUDA): In 2006, several years before the deep learning boom, NVIDIA began investing in CUDA, a general-purpose computing platform for GPUs. There was no market at the time and investors criticized the move, but the company bet on a technological shift, the collapse in the cost of parallel computing, kept investing while confirming the signal of researchers starting to use GPUs (Raina, Madhavan & Ng, 2009; Krizhevsky, Sutskever & Hinton, 2012), and waited for application domains to emerge (Witt, 2025). It is the archetype of technology-driven forecasting combined with step-by-step updating
- Intel (strategic inflection points): In 1985, CEO Andy Grove read the signal that profits in Intel's core memory business were evaporating as Japanese manufacturers entered the market, abandoned the business the company was founded on, and focused on microprocessors. Drawing on this experience, Grove named the early warning signs of a shift in industry structure "strategic inflection points" and systematized a method for detecting them (Grove, 1996). It is a case showing that the decision to exit is also an output of market forecasting
- Netflix (streaming): Although it started with DVD rental by mail when it was founded in 1997, Netflix put "Net" in its name and anticipated that the spread of broadband and falling communication costs (the cost curve) would eventually move the business to online delivery. It launched streaming in 2007 and replaced its own core business (Keating, 2012). It is a case of extrapolating a cost curve and choosing to be the first to ride a disruptive innovation, even at the expense of one's own business
- Shell (scenario planning): As described above, Shell prepared oil crisis scenarios in the early 1970s and responded to the 1973 oil shock faster than its competitors (Wack, 1985). It is the prototype of corporate foresight, with a scenario unit that has been maintained for half a century
- What empirical research says about corporate foresight: A study that tracked 83 European companies over seven years found that companies with a well-developed foresight function were 33% more profitable than those without, and grew their market capitalization at roughly twice the rate (Rohrbeck & Kum, 2018). It is evidence that what drives performance is not a one-off forecast but a standing exploration function
Researchers
- Richard Hamming (Bell Labs): Hamming identified two traits shared by researchers who produce major results: choosing important problems, and working with the door open (staying open to the information around you). He set aside every Friday afternoon to ask "What are the important problems, and why am I not working on them?", and recommended entering fields early, while they are still opening up (Hamming, 1986). It is a practical version of continuous signal detection and early entry
- Katalin Karikó (mRNA research): From the 1990s onward, Karikó persisted with the therapeutic application of mRNA, a field that attracted almost no funding at the time. Despite being demoted at her university and having grant applications rejected, in 2005 she published a method using modified nucleosides to suppress the immunogenicity of mRNA, which became the foundation of the mRNA vaccines of 2020 and led to the 2023 Nobel Prize in Physiology or Medicine (Karikó et al., 2005). Her case embodies two points: that "entering too early" in a research field operates on a different time scale from "entering too early" in business, and that the lag between invention and diffusion can stretch to decades (Comin & Hobijn, 2010)
- The GPU and deep learning researchers: In 2009, a group at Stanford University showed that using GPUs could speed up the training of deep learning models by a factor of several dozen (Raina, Madhavan & Ng, 2009). In 2012, a group at the University of Toronto won an image recognition competition by a wide margin with a neural network trained on two GPUs, marking the starting point of the deep learning boom (Krizhevsky, Sutskever & Hinton, 2012). It is a case of converting a technological signal, the collapse in the cost of parallel computing, into a research agenda at a stage when most researchers were not yet paying attention
- What the empirical evidence says about choosing: A study analyzing 17.9 million papers found that the highest-impact papers share a distinctive structure: they consist mostly of conventional combinations of established knowledge, with a single unusual combination mixed in (Uzzi et al., 2013). Combine this with the finding that bets on new fields yield high impact but also fail at high rates (Foster, Rzhetsky & Evans, 2015), and a pattern emerges: outstanding researchers enter early by building on what they have already accumulated and taking one step into an adjacent field that is beginning to grow.
Nations
- Singapore (RAHS): Since 2004, Singapore has maintained RAHS (Risk Assessment and Horizon Scanning) as a permanent government function, institutionalizing the detection of weak signals. In 2009 it went further, establishing the Centre for Strategic Futures within the Prime Minister's Office to coordinate scenario planning across ministries (Habegger, 2010). This is an example of running a signal-scanning operation continuously at national scale.
- Japan (Science and Technology Foresight Survey): Japan has conducted a Delphi survey roughly every five years since 1971. In the 11th survey, several thousand experts forecast when each of around 700 science and technology topics would be realized. Spanning half a century, it is the longest-running Delphi survey in the world (National Institute of Science and Technology Policy, 2019).
- United Kingdom (Foresight Programme): Launched in 1994 under the Government Office for Science, the programme convenes cross-disciplinary expert panels to examine technological and social change 10 to 20 years out and feed the results into policy (Habegger, 2010).
- United States (DARPA): The Defense Advanced Research Projects Agency was founded in 1958 in response to the Soviet launch of the Sputnik satellite. It has funded technology areas at a stage when no market existed at all, including the precursor to the internet (ARPANET), GPS, and autonomous vehicles (the 2004 Grand Challenge), laying the foundations for what later became enormous markets (Fuchs, 2010). It has also been pointed out that many of the key technologies inside the iPhone trace back to public research funding (Mazzucato, 2013). This is a case of the state absorbing the long time horizon that "entering too early" demands.
- Taiwan (ITRI and TSMC): In the 1970s, the government-affiliated Industrial Technology Research Institute (ITRI) licensed semiconductor technology from the United States, and in 1987 TSMC was spun out of ITRI. Reading both the long-term growth of the semiconductor market and the structural shift toward separating chip design from manufacturing, Taiwan placed a national bet on a layer that did not yet exist: the pure-play foundry (Mathews, 1997).
Across these four categories, several common threads stand out.
- They do not make one-off predictions: Hamming's Friday afternoons, Sequoia's market criteria, Shell's scenario unit, and Singapore's RAHS are all standing mechanisms for continuously picking up signals.
- They respond early to technological and regulatory signals: NVIDIA, Netflix, DARPA, and Taiwan all moved before changes in cost curves or industry structure showed up in the numbers.
- They keep monitoring and updating after placing their bets: NVIDIA continuing to invest while confirming that researchers were actually using its GPUs, and Intel deciding to exit, are both examples of verifying and revising a forecast after it has been made.
- They match the time horizon to their role: Researchers and nations respond to the same signals on a horizon of decades, VCs on roughly ten years, and companies on five to ten years, and the earlier the entrant, the longer the lag they must absorb (Comin & Hobijn, 2010).
Recent research trends in forecasting growth markets
This section surveys research published mainly from the late 2010s through 2026. Over the past decade, the way researchers think about forecasting growth markets has shifted in the following ways.
Three developments that changed the picture
- Advances in data and computational methods: Text sources such as papers, patents, job postings, and earnings-call transcripts have become machine-readable and can now be processed at scale with deep learning. The question of where new fields will open up, which once depended on expert judgment or a handful of case studies, has become an empirical science tested against millions of data points (Bloom et al., 2021; Ebadi, Auger & Gauthier, 2022).
- Forecasting tournaments as an experimental platform: The geopolitical forecasting tournaments run by the US intelligence agency IARPA from 2011 onward produced the first large-scale dataset measuring and comparing the accuracy of thousands of forecasters on identical questions. This created a foundation for statistically testing who can forecast, by what methods, and how accurately (Mellers et al., 2014; Tetlock, Mellers & Scoblic, 2017).
- Two technological transitions: the energy transition and general-purpose AI: The fact that solar and battery costs fell consistently faster than the forecasts of major institutions supplied a wealth of material for retrospectively testing forecasting methods (Meng et al., 2021). At the same time, the arrival of large language models triggered a surge in demand for diffusion forecasts, asking which industries this general-purpose technology would reach and when, and that question itself became a subject of research (Eloundou et al., 2024).
The following sections give an overview of research trends on each topic.
Technology forecasting
- Establishing probabilistic forecasts based on experience curves: For a long time, the dominant view was that the rate at which a technology's cost and performance improve cannot be predicted. From the mid-2010s, a body of research accumulated that used the cost histories of more than 50 technologies to backtest probabilistic forecasts based on experience curves (Wright's law), demonstrating that such forecasts can deliver confidence intervals that account for the distribution of forecast errors (Farmer & Lafond, 2016; Lafond et al., 2018). The decisive study compared expert estimates for energy technologies against statistical model forecasts after the fact: the statistical models were more accurate than the experts, who systematically underestimated cost declines (Meng et al., 2021). Applying this insight to probabilistic forecasts of cost declines for solar, wind, and batteries leads to the conclusion that the faster the energy transition proceeds, the lower its total cost (Way et al., 2022).
- Extending forecasts to technologies without a market: The scope of forecasting has expanded from technologies with cost histories to technologies that do not yet have a market. A method was developed to estimate improvement rates by technology field from patent data, producing forecasts of annual improvement rates for 1,757 technology domains (Singh, Triulzi & Magee, 2021). For emerging technologies themselves, a framework was proposed that defines them by five attributes: radical novelty, relatively fast growth, coherence, prominent impact, and uncertainty (Rotolo, Hicks & Martin, 2015). Building on this framework, research has shown that feeding multiple patent indicators into machine learning models can classify, at an early stage, the technologies that later went on to grow (Lee et al., 2018). Methods for detecting weak signals in the text of papers, patents, and news using deep learning have also advanced (Zhou et al., 2020; Ebadi, Auger & Gauthier, 2022), and the EU's Joint Research Centre now runs them as an annual operational process (European Commission Joint Research Centre, 2024).
- Where this leaves us: The questions "When will this technology become economically viable?" and "Which technology will take off next?" can now be answered on statistical grounds rather than expert intuition. Of the limitations of market forecasting discussed later, both the trap of linear extrapolation and the tendency of experts to underestimate can be corrected with these methods. Because the data and methods are publicly available, individual researchers and small and medium-sized companies can now conduct exploration at the same level.
Diffusion and demand
- Tracking diffusion through text data: The spread of a new technology used to be measured only once sales or adoption rates appeared in official statistics. In the 2020s, researchers developed a method that combines the text of corporate earnings-call transcripts, patents, and job postings to track when 29 disruptive technologies, including cloud computing and smartphones, spread to which companies and which cities. It showed that employment tied to a new technology is initially concentrated in a few pioneer cities and diffuses over time (Bloom et al., 2021). A study that used job postings to test whether machine learning meets the criteria of a general-purpose technology (rapid improvement, penetration across a wide range of industries, and the spawning of complementary innovation) confirmed that it exhibits these general-purpose properties more strongly than other emerging technologies (Goldfarb, Taska & Teodoridis, 2023). For large language models, the share of the labor market affected has been estimated from the task composition of each occupation, with roughly 80% of workers projected to see some portion of their work affected (Eloundou et al., 2024). In short, public data such as job postings and earnings calls have been shown to work as leading indicators that run several years ahead of market statistics.
- Causal evidence that demand drives invention: On the demand side, researchers have causally tested whether expectations of future market size actually steer the direction of invention. In pharmaceuticals, disease areas whose future market size is projected to be larger based on demographic trends see more new drug development (Acemoglu & Linn, 2004), with an estimated elasticity of roughly a 0.2% increase in the number of new drugs for every 1% expansion in market size (Dubois et al., 2015). In the auto industry, manufacturers in countries where fuel prices rose shifted their patenting away from internal combustion engines and toward clean technologies such as electrification (Aghion et al., 2016), and countries with a heavier burden of a given disease produce and export more of the drugs that treat it, evidence that demand shapes even where production is located (Costinot et al., 2019). The implication is that a market forecast is not only a question of whether it proves correct, but also a competitive question of whether others will make the same forecast and enter.
- The path and the time from science to market: The path from science to market, and the time it takes, can now be measured as well. A study analyzing the citation network linking 4.8 million patents and 32 million papers showed that patents with higher market value sit closer to basic science, while more influential papers sit closer to technological application (Ahmadpoor & Jones, 2017). With the development of a database of the papers cited by patents, it is now possible to track at scale which fields of science are being used by industry (Marx & Fuegi, 2020). On the other hand, investment in a general-purpose technology shows up in productivity only after complementary investment in intangible assets such as business processes, talent, and data, and during that period the statistics trace a "J-curve" in which productivity appears to dip temporarily (Brynjolfsson, Rock & Syverson, 2021). For general-purpose AI, this line of research suggests that the rate-limiting step in diffusion will be the preparation of business processes and data rather than improvements in the performance of foundation models.
Research frontiers
- Declining disruption and the rigidity of mature fields: Large-scale data is also beginning to answer the questions of where new research areas open up and where researchers should place their bets. A study analyzing 45 million papers and 3.9 million patents showed that the share of "disruptive" work—work that overturns existing knowledge—has been steadily declining across every field (Park, Leahey & Funk, 2023), and it has also been confirmed that the larger and more mature a field becomes, the harder it is for new ideas to take hold (Chu & Evans, 2021). On the researchers' side, analysis of millions of papers shows that while a conservative strategy of concentrating on already-established, fashionable areas dominates, bets on new areas are what generate high impact (Foster, Rzhetsky & Evans, 2015)
- The time lag in recognizing novelty: Novelty is recognized only with a delay. Highly novel papers containing atypical combinations show a "delayed recognition" pattern: they are cited less in the short term but exert greater influence over the long term (Wang, Veugelers & Stephan, 2017), and the papers with the greatest impact were built on a foundation of conventional combinations of knowledge with just a single atypical combination added (Uzzi et al., 2013). That said, a "pivot penalty"—a drop in the impact of their work when researchers switch to topics far from their specialty—has also been confirmed at scale (Hill et al., 2025), so the rational way to enter a new area is in a form adjacent to what one has already built up
- Where things stand: In sum, there is a regularity here: new areas tend to open up not at the center of large, mature fields but at the boundaries between fields and in small fields. The current state of knowledge is that the "growth market" for a researcher or inventor is a boundary area adjacent to their own specialty that is not yet crowded
Human and AI Judgment
- Comparing aggregation methods: When forecasts are produced by pooling human judgments, data from forecasting tournaments has been used to test which ways of collecting and aggregating them are most accurate. "Prediction polls," in which participants state probabilities directly and the results are aggregated statistically, proved as accurate as or more accurate than prediction markets (Atanasov et al., 2017), and accuracy improves further when aggregation includes "extremizing"—pushing the averaged probability toward 0 or 1 (Satopää et al., 2014). For the Delphi method, a review has laid out the conditions that improve accuracy (diversity of participants, quality of feedback, and number of iterations) (Rowe & Wright, 1999). The practical implication is that collecting probabilities anonymously and aggregating them statistically is more accurate than reaching consensus in a meeting, and that comparable accuracy can be achieved without incurring the cost of running a prediction market
- The arrival of LLMs and their limits: Since 2023, large language models (LLMs) have emerged as forecasters. Forecasts from an ensemble of 12 LLMs achieved accuracy statistically indistinguishable from the collective wisdom of 925 humans (Schoenegger et al., 2024a), and LLMs augmented with up-to-date information via search and with optimized reasoning procedures are approaching the performance of human forecasting crowds on individual questions (Halawi et al., 2024). In an experiment that gave human forecasters an LLM assistant, accuracy improved significantly compared with forecasting without one (Schoenegger et al., 2024b). On the other hand, comparisons on a continuously updated benchmark have confirmed that even state-of-the-art LLMs still fall short of trained superforecasters (Karger et al., 2024), so full automation remains some way off
- Where things stand: The current position is that AI dramatically lowers the cost of the upstream stages of forecasting—searching, presenting base rates, and drafting scenarios—while the final probability judgment and the decision to update are, for now, made more accurately by trained humans. The division of labor in which "AI searches, humans judge, AI monitors, and humans update" is the most accurate configuration that current research points to. Thanks to this division of labor, scanning at a level that was once possible only for national governments and VCs is now within reach of individual researchers and ordinary operating companies
The Limits of Growth-Market Forecasting
So far we have surveyed the sources, methods, practices, and latest research for identifying growth markets. To close, we lay out the limits inherent in market forecasting. These limits fall into four categories: human cognition, market structure, the self-referential nature of forecasts, and data and methods.
The Limits of Cognition
- The accuracy of expert forecasts: Large-scale, long-term validation has shown that expert forecasts are about as accurate as random guessing. A study that tracked roughly 28,000 forecasts by 284 experts over 20 years found that experts' hit rate was roughly the same as that of "dart-throwing chimpanzees"; those who explained everything through one big theory (the "hedgehogs") performed worst, while those who flexibly absorbed miscellaneous information (the "foxes") did relatively better (Tetlock, 2005). The same holds in market forecasting: a survey commissioned by AT&T in the early 1980s predicted about 900,000 U.S. mobile phone subscriptions by 2000, undershooting the actual figure of roughly 109 million by more than a hundredfold (The Economist, 1999). For solar power, too, the deployment forecasts of major institutions fell short of actual results almost every year, and even when results exceeded the forecasts, the following year's forecasts were not raised enough (Creutzig et al., 2017)
- Regularities in the distortion: The direction of these distortions follows regular patterns. First, technology diffusion follows S-curves and exponential growth, yet humans extrapolate recent trends in a straight line, producing the error of "overestimating change in the next two years and underestimating change in the next ten" (Gates, 1996; Rogers, 1962). Retrospective comparison against statistical models has confirmed that experts systematically underestimated cost declines in energy technologies (Meng et al., 2021). Second, because disruptive innovations have low performance and small markets when they first appear, analysis based on the voice of existing customers and data from existing markets judges them to be "negligible" (Christensen, 1997). Third, when a forecast is built up "from the inside" of one's own project, the planning fallacy skews it systematically toward optimism. In an analysis of 258 public works projects, 90% had underestimated their costs (Kahneman & Tversky, 1979; Flyvbjerg, Holm & Buhl, 2002)
- The conservatism of researchers: Researchers are subject to the same kind of distortion. They tend to adopt a conservative strategy of concentrating on already-established, fashionable areas, but analysis of millions of papers shows that although bets on new areas fail more often, their impact when they succeed is large—and that, as a collective, researchers make conservative choices to excess (Foster, Rzhetsky & Evans, 2015). In areas whose growth is already obvious to everyone, competition is intense and the gains from early entry have evaporated; excess returns exist only in forecasts that depart from the consensus (Thiel & Masters, 2014)
The Limits of Structure
- Distinguishing risk from uncertainty: A distinction has long been drawn between predictable "risk" and unpredictable "uncertainty." Whereas risk allows probabilities to be calculated from past frequencies, uncertainty for which no past reference exists (Knightian uncertainty) does not even permit a probability to be defined—and the emergence of a new market often belongs to the latter category (Knight, 1921). Moreover, in domains where the distribution of outcomes departs sharply from the normal distribution, rare events determine most of the results, so average-based forecasts are systematically wrong. It has been empirically confirmed that the value of venture investments and of inventions has exactly this kind of distribution (Taleb, 2007; Scherer & Harhoff, 2000; Kerr, Nanda & Rhodes-Kropf, 2014)
- Increasing returns and path dependence: In markets where increasing returns and path dependence operate, small early accidents determine the winner, and this cannot be predicted in advance. Because network effects and learning effects strengthen the advantage of whichever technology spreads first, a technically inferior standard can come to dominate a market. This process has been modeled theoretically (Arthur, 1989) and is illustrated by the history of the QWERTY keyboard layout, which became entrenched despite not being technically optimal (David, 1985). In other words, even if we can predict "which market will grow," predicting "who will win in that market" is structurally difficult
- Bubbles as a structural feature: Phases of euphoria and bubbles are structurally built into the rollout of general-purpose technologies. In each of the five technological revolutions since the Industrial Revolution, financial capital flooded in excessively during the installation period, forming a bubble, and only after the crash did the deployment period begin (Perez, 2002). Even if a market's growth is forecast correctly, entering or investing during the bubble phase results in losses. The correctness of a forecast and the correctness of entry timing and price must be verified separately
The Limits of Self-Reference
- Self-fulfilling prophecies: In forecasting social phenomena, the very act of forecasting changes the behavior of what is being forecast. This structure of the "self-fulfilling prophecy" is a classic observation in sociology (Merton, 1948), and it applies directly to market forecasting. When the expectation that "this market will grow" becomes widely shared, entrants pour in; the growth does materialize, but the gain per entrant disappears. That expectations of future market size actually drive invention and entry has been causally confirmed in the pharmaceutical and automotive industries (Acemoglu & Linn, 2004; Dubois et al., 2015; Aghion et al., 2016)
- The "already priced in" problem: In the context of investing, this limit appears as the problem of being "already priced in." Because expectations based on public information are already reflected in prices, growth that everyone knows about generates no excess returns (Fama, 1970). The "growth trap," in which investments in growth industries and growth companies end up with disappointingly low returns, arises because expectations of growth are priced into the stock and investors end up paying too much (Siegel, 2005). Spotting growth and profiting from that growth are separate problems
- Goodhart's Law: When an indicator becomes a target, it loses its value as an indicator. This law—"when a statistic becomes a policy target, it loses its reliability as a statistic" (Goodhart, 1984)—applies to leading indicators as well. Once patent filings or job postings become widely known as "signals of a growth market," filings and postings made with that in mind increase, and the signal turns into noise. Leading indicators have their greatest predictive power only during the period before they are recognized as indicators
The Limits of Data and Methods
- New markets have no data: Quantitative methods require historical data, but a new market, by definition, has no history. The coefficients of a diffusion model cannot be estimated reliably until adoption reaches 10–20% of the market (Bass, 1969; Sultan, Farley & Lehmann, 1990); before that point, you are left with reference-class forecasting, borrowing coefficients from analogous cases (Kahneman & Tversky, 1979). Yet the choice of what counts as "analogous" drives the result, and that choice in turn rests on the forecaster's judgment. The finding that statistical models outperform experts (Meng et al., 2021) is a conclusion about technologies with decades of cost history, and it does not transfer directly to technologies that have none.
- Machine learning struggles with regime shifts: Machine learning can only learn from past patterns, which leaves it weak at moments when the underlying structure changes, i.e., regime shifts. In a large-scale forecasting competition spanning 100,000 time series, pure machine learning methods underperformed simple statistical methods, and combinations of multiple methods proved the most accurate (Makridakis, Spiliotis & Assimakopoulos, 2018; Makridakis et al., 2020). Large language models tell a similar story: alongside reports that they can match the collective judgment of human crowds, continuously updated benchmarks confirm that they still fall short of trained superforecasters (Schoenegger et al., 2024a; Karger et al., 2024).
- False positives in signal detection: Signal detection is haunted by the problem of false positives. The very definition of an emerging technology carries uncertainty (Rotolo, Hicks & Martin, 2015), and "hype," in which a technology attracts attention and then stalls, is far from rare. The "hype cycle," which charts how expectations for a technology rise and fall, is widely used in practice, but researchers have noted that the empirical support for generalizing its shape is thin (Dedehayir & Steinert, 2016). Most weak signals turn out, in hindsight, to have been noise that led nowhere.
Where This Leaves Us
- Probabilities, updating, and combining: These limitations are not a reason to give up on forecasting; they are a reason to change how forecasts are used. First, the output of a forecast is a probability distribution, not a point, and it must be handled as a range. Second, probabilities are meant to be updated every time new information arrives; clinging to a forecast once it has been made is the single biggest cause of failure. The roughly 30% margin by which trained forecasters outperformed intelligence analysts came largely from this habit of updating (Mellers et al., 2014; Tetlock & Gardner, 2015). Third, relying on a combination of methods rather than any single one is a conclusion consistently supported both by half a century of forecasting research and by the most recent competitions (Armstrong, 2001; Makridakis et al., 2020).
- Complementing forecasting with foresight: The uncertainty that forecasting cannot handle is the domain of foresight. For futures that cannot be called, it is more rational to sketch multiple scenarios, monitor leading indicators, and prepare decisions that hold up whichever scenario arrives than to bet everything on a single forecast (Schoemaker, 1995; Wack, 1985). Forecasts miss because methods are flawed, and methods can be improved. But even improved methods have limits, and designing decisions on the assumption of those limits is the next step after forecasting.
Conclusion
This article has laid out the approaches available for finding growth markets. While none of the methods described here can predict a growth market with certainty, they show that a scientific approach makes it possible to forecast with the highest probability attainable. We believe these approaches will prove useful for anticipating how markets will evolve in the coming age of AI.
References
- Acemoglu, D., & Linn, J. (2004). Market size in innovation: Theory and evidence from the pharmaceutical industry. Quarterly Journal of Economics, 119(3), 1049–1090. (Empirically demonstrates that the market size implied by demographics determines the direction of new drug development.)
- Aghion, P., Dechezleprêtre, A., Hémous, D., Martin, R., & Van Reenen, J. (2016). Carbon taxes, path dependency, and directed technical change: Evidence from the auto industry. Journal of Political Economy, 124(1), 1–51. (Empirically shows that rising fuel prices increase automakers' patenting of clean technologies.)
- Aguilar, F. J. (1967). Scanning the business environment. Macmillan. (Systematized the scanning of a firm's external environment and became the prototype for PEST analysis.)
- Ahmadpoor, M., & Jones, B. F. (2017). The dual frontier: Patented inventions and prior scientific advance. Science, 357(6351), 583–587. (Measures the distance between science and technology using patent and paper citation networks, showing that patents with high market value lie close to basic science.)
- Andreessen, M. (2011, August 20). Why software is eating the world. The Wall Street Journal. (An op-ed setting out the investment thesis that software will restructure every industry.)
- Ansoff, H. I. (1975). Managing strategic surprise by response to weak signals. California Management Review, 18(2), 21–33. (Proposes responding to the "weak signals" that precede major change.)
- Armstrong, J. S. (Ed.). (2001). Principles of forecasting: A handbook for researchers and practitioners. Kluwer Academic Publishers. (A handbook compiling the principles of forecasting research and showing that combining methods improves accuracy.)
- Arrow, K. J., Forsythe, R., Gorham, M., Hahn, R., Hanson, R., Ledyard, J. O., Levmore, S., Litan, R., Milgrom, P., Nelson, F. D., Neumann, G. R., Ottaviani, M., Schelling, T. C., Shiller, R. J., Smith, V. L., Snowberg, E., Sunstein, C. R., Tetlock, P. C., Tetlock, P. E., … Zitzewitz, E. (2008). The promise of prediction markets. Science, 320(5878), 877–878. (Discusses the effectiveness of prediction markets and their potential for policy.)
- Arthur, W. B. (1989). Competing technologies, increasing returns, and lock-in by historical events. Economic Journal, 99(394), 116–131. (Theorizes that under increasing returns, early chance events decide the winner, making advance prediction difficult.)
- Atanasov, P., Rescober, P., Stone, E., Swift, S. A., Servan-Schreiber, E., Tetlock, P., Ungar, L., & Mellers, B. (2017). Distilling the wisdom of crowds: Prediction markets vs. prediction polls. Management Science, 63(3), 691–706. (Empirically shows that statistically aggregated prediction polls are at least as accurate as prediction markets.)
- Bass, F. M. (1969). A new product growth for model consumer durables. Management Science, 15(5), 215–227. (The original paper on the Bass model, which formalizes new-product diffusion in terms of coefficients of innovation and imitation.)
- Bass, F. M., Gordon, K., Ferguson, T. L., & Githens, M. L. (2001). DIRECTV: Forecasting diffusion of a new technology prior to product launch. Interfaces, 31(3), S82–S93. (Reports a pre-launch Bass-model forecast of satellite TV subscriber numbers that closely matched actual results.)
- Bloom, N., Hassan, T. A., Kalyani, A., Lerner, J., & Tahoun, A. (2021). The diffusion of disruptive technologies (NBER Working Paper No. 28999). National Bureau of Economic Research. (Tracks the diffusion of 29 disruptive technologies across firms and regions using text from earnings calls, patents, and job postings.)
- Boston Consulting Group. (1968). Perspectives on experience. Boston Consulting Group. (The report that brought Wright's law into corporate strategy as the "experience curve.")
- Bresnahan, T. F., & Trajtenberg, M. (1995). General purpose technologies: 'Engines of growth'? Journal of Econometrics, 65(1), 83–108. (Shows that general purpose technologies generate growth through chains of complementary innovation.)
- Bryar, C., & Carr, B. (2021). Working backwards: Insights, stories, and secrets from inside Amazon. St. Martin's Press. (An insider's account of Amazon's customer-first, work-backwards process.)
- Brynjolfsson, E., Rock, D., & Syverson, C. (2021). The productivity J-curve: How intangibles complement general purpose technologies. American Economic Journal: Macroeconomics, 13(1), 333–372. (Describes the J-curve by which investment in general-purpose technologies shows up in productivity only after complementary intangible assets have been built up.)
- Chen, K.-Y., & Plott, C. R. (2002). Information aggregation mechanisms: Concept, design and implementation for a sales forecasting problem (Social Science Working Paper No. 1131). California Institute of Technology. (Reports that an internal prediction market at HP outperformed the company's official sales forecasts.)
- Christensen, C. M. (1997). The innovator's dilemma: When new technologies cause great firms to fail. Harvard Business School Press. (Explains why disruptive innovations remain invisible to the market analysis of incumbent firms.)
- Christensen, C. M., Hall, T., Dillon, K., & Duncan, D. S. (2016). Know your customers' "jobs to be done". Harvard Business Review, 94(9), 54–62. (Lays out the jobs-to-be-done theory, which redefines markets in terms of the "jobs" customers are trying to get done.)
- Chu, J. S. G., & Evans, J. A. (2021). Slowed canonical progress in large fields of science. Proceedings of the National Academy of Sciences, 118(41), e2021636118. (Shows that the larger and more mature a field becomes, the harder it is for new ideas to take hold.)
- Collantes, G., & Sperling, D. (2008). The origin of California's zero emission vehicle mandate. Transportation Research Part A: Policy and Practice, 42(10), 1302–1313. (Analyzes how California's 1990 ZEV mandate came into being, identifying it as the starting point from which regulation steered the EV market.)
- Comin, D., & Hobijn, B. (2010). An exploration of technology diffusion. American Economic Review, 100(5), 2031–2059. (Shows that the lag from invention to adoption averages 45 years, and that differences in this lag explain income gaps between countries.)
- Costinot, A., Donaldson, D., Kyle, M., & Williams, H. (2019). The more we die, the more we sell? A simple test of the home-market effect. Quarterly Journal of Economics, 134(2), 843–894. (Shows that countries with a heavier burden of a given disease produce and export more of the drugs that treat it, providing empirical evidence that demand shapes where production is located.)
- Cowgill, B., & Zitzewitz, E. (2015). Corporate prediction markets: Evidence from Google, Ford, and Firm X. Review of Economic Studies, 82(4), 1309–1341. (Shows that internal prediction markets at Google and Ford produced well-calibrated probabilities and corrected the optimism bias in official forecasts.)
- Creutzig, F., Agoston, P., Goldschmidt, J. C., Luderer, G., Nemet, G., & Pietzcker, R. C. (2017). The underestimated potential of solar energy to mitigate climate change. Nature Energy, 2, 17140. (Analyzes why major institutions' forecasts of solar deployment were systematically and persistently too low.)
- Dalkey, N., & Helmer, O. (1963). An experimental application of the Delphi method to the use of experts. Management Science, 9(3), 458–467. (Reports the first experimental application of the Delphi method.)
- David, P. A. (1985). Clio and the economics of QWERTY. American Economic Review, 75(2), 332–337. (Uses the entrenchment of the QWERTY keyboard layout to show how path dependence can let a technically suboptimal standard win the market.)
- David, P. A. (1990). The dynamo and the computer: An historical perspective on the modern productivity paradox. American Economic Review, 80(2), 355–361. (Draws on the roughly 40-year delay in electricity's productivity payoff to illustrate the time structure of general-purpose technologies.)
- Day, G. S., & Schoemaker, P. J. H. (2006). Peripheral vision: Detecting the weak signals that will make or break your company. Harvard Business School Press. (Explains why organizations miss weak signals and how they can sharpen their peripheral vision.)
- Dedehayir, O., & Steinert, M. (2016). The hype cycle model: A review and future directions. Technological Forecasting and Social Change, 108, 28–41. (A review concluding that there is little research support for the idea that the shape of the hype cycle can be empirically generalized.)
- Drucker, P. F. (1997). The future that has already happened. Harvard Business Review, 75(5), 20–24. (Introduces the idea of using demographics as "the future that has already happened" for forecasting.)
- Dubois, P., de Mouzon, O., Scott-Morton, F., & Seabright, P. (2015). Market size and pharmaceutical innovation. RAND Journal of Economics, 46(4), 844–871. (Estimates an elasticity whereby a 1% increase in market size yields roughly a 0.2% increase in the number of new drugs.)
- Ebadi, A., Auger, A., & Gauthier, Y. (2022). Detecting emerging technologies and their evolution using deep learning and weak signal analysis. Journal of Informetrics, 16(4), 101344. (Presents a method for detecting emerging technologies using deep learning and weak-signal analysis.)
- The Economist. (1999, October 7). Cutting the cord. (Reports the case in which 1980s forecasts of the mobile phone market fell short of actual results by a factor of more than 100.)
- Eloundou, T., Manning, S., Mishkin, P., & Rock, D. (2024). GPTs are GPTs: Labor market impact potential of LLMs. Science, 384(6702), 1306–1308. (Estimates the breadth of labor-market impact from large language models based on the task composition of occupations.)
- European Commission Joint Research Centre. (2024). Weak signals in science and technologies 2024. Publications Office of the European Union. (The EU's annual, operational report on weak-signal detection.)
- Fama, E. F. (1970). Efficient capital markets: A review of theory and empirical work. Journal of Finance, 25(2), 383–417. (Lays out the efficient market hypothesis, which holds that public information is already reflected in prices.)
- Farmer, J. D., & Lafond, F. (2016). How predictable is technological progress? Research Policy, 45(3), 647–665. (Shows that probabilistic forecasts of technology costs based on experience curves achieve practically useful accuracy.)
- Felin, T., & Zenger, T. R. (2017). The theory-based view: Economic actors as theorists. Strategy Science, 2(4), 258–271. (Presents the theory-based view of strategy, which holds that a market's promise becomes visible only through a firm's own theory.)
- Flyvbjerg, B. (2006). From Nobel Prize to project management: Getting risks right. Project Management Journal, 37(3), 5–15. (Applies reference class forecasting to practice and shows how to counter the planning fallacy.)
- Flyvbjerg, B., Holm, M. S., & Buhl, S. (2002). Underestimating costs in public works projects: Error or lie? Journal of the American Planning Association, 68(3), 279–295. (Shows that 90% of 258 infrastructure projects ran over budget, underscoring the need for reference class forecasting.)
- Forsythe, R., Nelson, F., Neumann, G. R., & Wright, J. (1992). Anatomy of an experimental political stock market. American Economic Review, 82(5), 1142–1161. (Reports that the Iowa Electronic Markets predicted election outcomes more accurately than opinion polls.)
- Foster, J. G., Rzhetsky, A., & Evans, J. A. (2015). Tradition and innovation in scientists' research strategies. American Sociological Review, 80(5), 875–908. (Draws on millions of papers to show that while conservative topic choices dominate among researchers, bets on new areas are what generate high impact.)
- Fuchs, E. R. H. (2010). Rethinking the role of the state in technology development: DARPA and the case for embedded network governance. Research Policy, 39(9), 1133–1147. (Analyzes the mechanisms by which DARPA invests in technology areas at a stage when no market yet exists.)
- Garfield, E. (1955). Citation indexes for science: A new dimension in documentation through association of ideas. Science, 122(3159), 108–111. (Proposed the citation index for scholarly papers, laying the foundation for scientometrics.)
- Gates, B. (1996). The road ahead (Rev. ed.). Penguin Books. (Points out the human tendency to overestimate change in the short term and underestimate it in the long term.)
- Goldfarb, A., Taska, B., & Teodoridis, F. (2023). Could machine learning be a general purpose technology? A comparison of emerging technologies using data from online job postings. Research Policy, 52(1), 104653. (Uses job-posting data to test whether machine learning meets the criteria for a general purpose technology.)
- Goldin, C. (2006). The quiet revolution that transformed women's employment, education, and family. American Economic Review, 96(2), 1–21. (Analyzes the expansion of women's employment and career formation as a "quiet revolution.")
- Gompers, P. A., Gornall, W., Kaplan, S. N., & Strebulaev, I. A. (2020). How do venture capitalists make decisions? Journal of Financial Economics, 135(1), 169–190. (Surveys 885 venture capitalists to identify the factors behind investment decisions and how they are weighted.)
- Goodhart, C. A. E. (1984). Monetary theory and practice: The UK experience. Macmillan. (Sets out "Goodhart's Law": once a statistical measure becomes a policy target, it ceases to be a reliable indicator.)
- Goodwin, P., Dyussekeneva, K., & Meeran, S. (2013). The use of analogies in forecasting the annual sales of new electronics products. IMA Journal of Management Mathematics, 24(4), 407–423. (Shows that forecasting new-product sales by analogy to similar products is more accurate than forecasts based on judgment alone.)
- Graham, P. (2012). How to get startup ideas. Y Combinator. (An essay presenting a method for discovering startup ideas: "live in the future, then build what's missing.")
- Griliches, Z. (1957). Hybrid corn: An exploration in the economics of technological change. Econometrica, 25(4), 501–522. (An econometric analysis of the S-curve of hybrid corn adoption, showing that the speed of diffusion is proportional to profitability.)
- Gross, B. (2015). The single biggest reason why start-ups succeed [Video]. TED Conferences. (A talk drawing on an analysis of more than 200 companies to show that timing is the single biggest factor in success.)
- Grove, A. S. (1996). Only the paranoid survive: How to exploit the crisis points that challenge every company. Currency Doubleday. (A first-hand analysis of how profits shifted when the PC industry moved from vertical integration to horizontal specialization.)
- Habegger, B. (2010). Strategic foresight in public policy: Reviewing the experiences of the UK, Singapore, and the Netherlands. Futures, 42(1), 49–58. (Compares government foresight systems across countries, including Singapore's RAHS.)
- Halawi, D., Zhang, F., Yueh-Han, C., & Steinhardt, J. (2024). Approaching human-level forecasting with language models. arXiv preprint arXiv:2402.18563. (Shows that LLMs augmented with retrieved information can approach the accuracy of human forecasting crowds.)
- Hall, B. H., Jaffe, A., & Trajtenberg, M. (2005). Market value and patent citations. RAND Journal of Economics, 36(1), 16–38. (Provides empirical evidence that the more frequently a patent is cited, the more it contributes to firm value.)
- Hamming, R. W. (1986). You and your research [Lecture]. Bell Communications Research Colloquium Seminar. (A lecture arguing that researchers who achieve great results choose important problems and enter opening fields early.)
- Hayek, F. A. (1945). The use of knowledge in society. American Economic Review, 35(4), 519–530. (Argues that prices serve to aggregate dispersed knowledge; the theoretical foundation of prediction markets.)
- Hill, R., Yin, Y., Stein, C., Wang, X., Wang, D., & Jones, B. F. (2025). The pivot penalty in research. Nature, 642, 999–1006. (Uses large-scale data to show that when researchers pivot to topics outside their specialty, their impact declines.)
- Jacobsson, S., & Lauber, V. (2006). The politics and policy of energy system transformation—explaining the German diffusion of renewable energy technology. Energy Policy, 34(3), 256–276. (Analyzes how Germany's Renewable Energy Act came into being and how it launched the solar power market.)
- Kahn, H., & Wiener, A. J. (1967). The year 2000: A framework for speculation on the next thirty-three years. Macmillan. (The foundational text of scenario planning, systematizing the scenario methods that originated at the RAND Corporation.)
- Kahneman, D., & Tversky, A. (1979). Intuitive prediction: Biases and corrective procedures. TIMS Studies in Management Science, 12, 313–327. (Presents the planning fallacy and a corrective procedure based on the outside view, i.e., reference classes.)
- Karger, E., Bastani, H., Yueh-Han, C., Jacobs, Z., Halawi, D., Zhang, F., & Tetlock, P. E. (2024). ForecastBench: A dynamic benchmark of AI forecasting capabilities. arXiv preprint arXiv:2409.19839. (Uses a continuously updated benchmark to show that state-of-the-art LLMs still fall short of superforecasters.)
- Karikó, K., Buckstein, M., Ni, H., & Weissman, D. (2005). Suppression of RNA recognition by Toll-like receptors: The impact of nucleoside modification and the evolutionary origin of RNA. Immunity, 23(2), 165–175. (Demonstrated the modified-nucleoside method that became the basis for mRNA vaccines; the work recognized by the 2023 Nobel Prize.)
- Keating, G. (2012). Netflixed: The epic battle for America's eyeballs. Portfolio/Penguin. (Chronicles how Netflix anticipated the shift to streaming from its founding and replaced its own core business.)
- Kerr, W. R., Nanda, R., & Rhodes-Kropf, M. (2014). Entrepreneurship as experimentation. Journal of Economic Perspectives, 28(3), 25–48. (Shows that VC returns follow a skewed distribution dependent on a handful of major successes, and that investments function as experiments.)
- Kharas, H. (2017). The unprecedented expansion of the global middle class: An update (Global Economy & Development Working Paper No. 100). Brookings Institution. (Estimates the rapid growth of the global middle class and its concentration in Asia.)
- Knight, F. H. (1921). Risk, uncertainty and profit. Houghton Mifflin. (A classic of economics that distinguishes risk, whose probabilities can be calculated, from uncertainty, whose probabilities cannot.)
- Krizhevsky, A., Sutskever, I., & Hinton, G. E. (2012). ImageNet classification with deep convolutional neural networks. Advances in Neural Information Processing Systems, 25, 1097–1105. (The paper in which a GPU-trained deep neural network decisively won an image-recognition competition, sparking the deep-learning boom.)
- Lafond, F., Bailey, A. G., Bakker, J. D., Rebois, D., Zadourian, R., McSharry, P., & Farmer, J. D. (2018). How well do experience curves predict technological progress? A method for making distributional forecasts. Technological Forecasting and Social Change, 128, 104–117. (Proposes a method for probabilistic forecasts based on experience curves and validates it across more than 50 technologies.)
- Lee, C., Kwon, O., Kim, M., & Kwon, D. (2018). Early identification of emerging technologies: A machine learning approach using multiple patent indicators. Technological Forecasting and Social Change, 127, 291–303. (Presents a method for identifying emerging technologies early by combining multiple patent indicators with machine learning.)
- Lee, J., Veloso, F. M., & Hounshell, D. A. (2011). Linking induced technological change, and environmental regulation: Evidence from patenting in the U.S. auto industry. Research Policy, 40(9), 1240–1252. (Provides empirical evidence that U.S. emissions regulations induced patent filings for emissions-control technology in the auto industry.)
- Levitt, T. (1983). The marketing imagination. Free Press. (The book that popularized the insight that "customers don't want a drill, they want a hole.")
- Lilien, G. L., Morrison, P. D., Searls, K., Sonnack, M., & von Hippel, E. (2002). Performance assessment of the lead user idea-generation process for new product development. Management Science, 48(8), 1042–1059. (Shows that at 3M, the lead-user method generated roughly eight times the sales potential of conventional approaches.)
- Makridakis, S., Spiliotis, E., & Assimakopoulos, V. (2018). Statistical and machine learning forecasting methods: Concerns and ways forward. PLoS ONE, 13(3), e0194889. (Shows that pure machine-learning methods underperform simple statistical methods, and lays out the limitations of machine learning in forecasting.)
- Makridakis, S., Spiliotis, E., & Assimakopoulos, V. (2020). The M4 Competition: 100,000 time series and 61 forecasting methods. International Journal of Forecasting, 36(1), 54–74. (Reports that in a forecasting competition spanning 100,000 time series, combinations of multiple methods proved the most accurate.)
- Marx, M., & Fuegi, A. (2020). Reliance on science: Worldwide front-page patent citations to scientific articles. Strategic Management Journal, 41(9), 1572–1594. (Builds a database of scientific papers cited by patents, making it possible to trace the link between science and industry at scale.)
- Mathews, J. A. (1997). A Silicon Valley of the East: Creating Taiwan's semiconductor industry. California Management Review, 39(4), 26–54. (Analyzes how the Taiwanese government created a semiconductor industry through ITRI and TSMC.)
- Mazzucato, M. (2013). The entrepreneurial state: Debunking public vs. private sector myths. Anthem Press. (Shows that many of the key technologies inside the iPhone trace back to public research funding, and argues for the role of the state as an early investor.)
- Mellers, B., Ungar, L., Baron, J., Ramos, J., Gurcay, B., Fincher, K., Scott, S. E., Moore, D., Atanasov, P., Swift, S. A., Murray, T., Stone, E., & Tetlock, P. E. (2014). Psychological strategies for winning a geopolitical forecasting tournament. Psychological Science, 25(5), 1106–1115. (Demonstrates in a forecasting tournament that training, teaming, and probability updating substantially improve forecast accuracy.)
- Meng, J., Way, R., Verdolini, E., & Diaz Anadon, L. (2021). Comparing expert elicitation and model-based probabilistic technology cost forecasts for the energy transition. Proceedings of the National Academy of Sciences, 118(27), e1917165118. (Shows that statistical models outperform expert estimates in forecasting energy-technology costs, and that experts underestimate cost declines.)
- Merton, R. K. (1948). The self-fulfilling prophecy. Antioch Review, 8(2), 193–210. (Formalizes the "self-fulfilling prophecy," in which a prediction changes the behavior of its subject and thereby brings itself about.)
- Myers, K. (2020). The elasticity of science. American Economic Journal: Applied Economics, 12(4), 103–134. (Uses NIH data to show empirically that researchers shift their topics in response to earmarked research funding.)
- Nagy, B., Farmer, J. D., Bui, Q. M., & Trancik, J. E. (2013). Statistical basis for predicting technological progress. PLoS ONE, 8(2), e52669. (Tests the predictive power of Wright's law using data on 62 technologies.)
- Park, M., Leahey, E., & Funk, R. J. (2023). Papers and patents are becoming less disruptive over time. Nature, 613, 138–144. (Draws on 45 million papers and 3.9 million patents to show that the share of disruptive work has been steadily declining.)
- Perez, C. (2002). Technological revolutions and financial capital: The dynamics of bubbles and golden ages. Edward Elgar. (Uses five historical waves to show that technological revolutions pass through an installation period, a bubble, a turning point, and a deployment period.)
- Popp, D. (2002). Induced innovation and energy prices. American Economic Review, 92(1), 160–180. (Provides empirical evidence that rising energy prices induce patent filings for energy-saving technologies.)
- Porter, M. E., & van der Linde, C. (1995). Toward a new conception of the environment-competitiveness relationship. Journal of Economic Perspectives, 9(4), 97–118. (Argues that well-designed regulation stimulates innovation and the creation of new markets.)
- Raina, R., Madhavan, A., & Ng, A. Y. (2009). Large-scale deep unsupervised learning using graphics processors. Proceedings of the 26th Annual International Conference on Machine Learning, 873–880. (Shows that GPUs dramatically accelerate deep-learning training, serving as an early signal of demand for GPU computing.)
- Rogers, E. M. (1962). Diffusion of innovations. Free Press. (The foundational text of diffusion theory, showing that the spread of innovations follows an S-curve.)
- Rohrbeck, R., & Kum, M. E. (2018). Corporate foresight and its impact on firm performance: A longitudinal analysis. Technological Forecasting and Social Change, 129, 105–116. (Empirical evidence that firms with a foresight function showed higher profitability and growth seven years later.)
- Rohrbeck, R., Battistella, C., & Huizingh, E. (2015). Corporate foresight: An emerging field with a rich tradition. Technological Forecasting and Social Change, 101, 1–9. (Maps the field of corporate foresight research and situates it in relation to forecasting.)
- Rotolo, D., Hicks, D., & Martin, B. R. (2015). What is an emerging technology? Research Policy, 44(10), 1827–1843. (Defines emerging technologies by five attributes, providing a shared framework for subsequent research.)
- Rowe, G., & Wright, G. (1999). The Delphi technique as a forecasting tool: Issues and analysis. International Journal of Forecasting, 15(4), 353–375. (A review of empirical studies assessing the forecasting accuracy of the Delphi method.)
- Ryan, B., & Gross, N. C. (1943). The diffusion of hybrid seed corn in two Iowa communities. Rural Sociology, 8(1), 15–24. (The origin of diffusion research: the first study to find that innovation adoption follows an S-curve.)
- Satopää, V. A., Baron, J., Foster, D. P., Mellers, B. A., Tetlock, P. E., & Ungar, L. H. (2014). Combining multiple probability predictions using a simple logit model. International Journal of Forecasting, 30(2), 344–356. (Shows that extremizing aggregated crowd probability forecasts improves accuracy.)
- Scherer, F. M., & Harhoff, D. (2000). Technology policy for a world of skew-distributed outcomes. Research Policy, 29(4–5), 559–566. (Shows that the economic value of inventions is extremely skewed, with a small minority accounting for most of the total value.)
- Schmookler, J. (1966). Invention and economic growth. Harvard University Press. (The classic statement of the demand-pull thesis, showing that the direction of invention responds to the size of demand.)
- Schoemaker, P. J. H. (1995). Scenario planning: A tool for strategic thinking. Sloan Management Review, 36(2), 25–40. (Lays out the procedure and strategic significance of scenario planning.)
- Schoemaker, P. J. H., & Day, G. S. (2009). How to make sense of weak signals. MIT Sloan Management Review, 50(3), 81–89. (Presents a method for systematically detecting and interpreting weak signals within an organization.)
- Schoenegger, P., Park, P. S., Karger, E., Trott, S., & Tetlock, P. E. (2024b). AI-augmented predictions: LLM assistants improve human forecasting accuracy. arXiv preprint arXiv:2402.07862. (Shows that human forecasters given an LLM assistant improve their accuracy significantly.)
- Schoenegger, P., Tuminauskaite, I., Park, P. S., & Tetlock, P. E. (2024a). Wisdom of the silicon crowd: LLM ensemble prediction capabilities rival human crowd accuracy. Science Advances, 10(45), eadp1528. (Shows that an ensemble of LLMs achieves forecasting accuracy comparable to the wisdom of human crowds.)
- Schwartz, P. (1991). The art of the long view: Planning for the future in an uncertain world. Doubleday. (Systematizes Shell's scenario planning practice and describes how it prepared the company for the 1986 oil price collapse.)
- Siegel, J. J. (2005). The future for investors: Why the tried and the true triumph over the bold and the new. Crown Business. (Uses long-run data to demonstrate the "growth trap," in which investments in growth industries end up delivering low returns.)
- Singh, A., Triulzi, G., & Magee, C. L. (2021). Technological improvement rate predictions for all technologies: Use of patent data and an extended domain description. Research Policy, 50(9), 104294. (Predicts annual rates of improvement for 1,757 technology domains using patent data.)
- Sultan, F., Farley, J. U., & Lehmann, D. R. (1990). A meta-analysis of applications of diffusion models. Journal of Marketing Research, 27(1), 70–77. (A meta-analysis of 213 applications of the Bass model, reporting typical values for the coefficients of innovation and imitation.)
- Taleb, N. N. (2007). The black swan: The impact of the highly improbable. Random House. (Argues that in domains where outcomes are not normally distributed, rare events dominate results and forecasts based on averages fail.)
- Tetlock, P. E. (2005). Expert political judgment: How good is it? How can we know? Princeton University Press. (Tracks the forecasting accuracy of experts over 20 years, revealing both its limits and the potential for improvement.)
- Tetlock, P. E., & Gardner, D. (2015). Superforecasting: The art and science of prediction. Crown. (Systematizes forecasting as a trainable skill.)
- Tetlock, P. E., Mellers, B. A., & Scoblic, J. P. (2017). Bringing probability judgments into policy debates via forecasting tournaments. Science, 355(6324), 481–483. (Proposes forecasting tournaments as a means of bringing probabilistic thinking into policy debates.)
- Thiel, P., & Masters, B. (2014). Zero to one: Notes on startups, or how to build the future. Crown Business. (Makes the case for investing in "secrets"—hidden truths that lie outside the consensus.)
- Uzzi, B., Mukherjee, S., Stringer, M., & Jones, B. (2013). Atypical combinations and scientific impact. Science, 342(6157), 468–472. (Shows that high-impact papers typically combine conventional knowledge with a single atypical element.)
- Valentine, D. (2010). View from the top [Lecture]. Stanford Graduate School of Business. (A lecture in which the founder of Sequoia Capital explains his view that market size is the first criterion in any investment decision.)
- von Hippel, E. (1976). The dominant role of users in the scientific instrument innovation process. Research Policy, 5(3), 212–239. (Shows that 77% of innovations in scientific instruments originated with users; the origin of the lead user method.)
- von Hippel, E. (1986). Lead users: A source of novel product concepts. Management Science, 32(7), 791–805. (The original paper on the lead user method, showing that users at the leading edge anticipate future demand.)
- von Hippel, E., Thomke, S., & Sonnack, M. (1999). Creating breakthroughs at 3M. Harvard Business Review, 77(5), 47–57. (Reports how 3M's medical division used the lead user method to generate new product concepts.)
- Wack, P. (1985). Scenarios: Uncharted waters ahead. Harvard Business Review, 63(5), 72–89. (A first-hand account of scenario planning practice at Shell.)
- Wang, J., Veugelers, R., & Stephan, P. (2017). Bias against novelty in science: A cautionary tale for users of bibliometric indicators. Research Policy, 46(8), 1416–1436. (Shows that highly novel papers are undervalued in the short term but exert greater influence over the long term.)
- Way, R., Ives, M. C., Mealy, P., & Farmer, J. D. (2022). Empirically grounded technology forecasts and the energy transition. Joule, 6(9), 2057–2082. (Using probabilistic forecasts based on experience curves, this paper shows that the faster the energy transition proceeds, the lower its total cost.)
- Wetterstrand, K. A. (2023). DNA sequencing costs: Data. National Human Genome Research Institute. (Public data tracking the cost of sequencing a human genome over time.)
- Witt, S. (2025). The thinking machine: Jensen Huang, Nvidia, and the world's most coveted microchip. Viking. (A book chronicling how NVIDIA invested early in CUDA and then waited for application markets to emerge.)
- Wolfers, J., & Zitzewitz, E. (2004). Prediction markets. Journal of Economic Perspectives, 18(2), 107–126. (A review of the theory and empirical evidence on prediction markets.)
- Wright, T. P. (1936). Factors affecting the cost of airplanes. Journal of the Aeronautical Sciences, 3(4), 122–128. (The original paper on Wright's law, which identified the relationship between cumulative production volume and cost decline.)
- Zhou, Y., Dong, F., Liu, Y., Li, Z., Du, J., & Zhang, L. (2020). Forecasting emerging technologies using data augmentation and deep learning. Scientometrics, 123, 1–29. (This paper presents a method for forecasting emerging technologies using data augmentation and deep learning.)
- Ziegler, M. S., & Trancik, J. E. (2021). Re-examining rates of lithium-ion battery technology improvement and cost decline. Energy & Environmental Science, 14(4), 1635–1651. (This paper shows that lithium-ion battery costs have declined in line with the experience curve.)
- National Institute of Population and Social Security Research. (2023). Population projections for Japan (2023 projection). Population Research Series No. 347. (An official report presenting the trajectory of Japan's aging rate and its future projections.)
- National Institute of Science and Technology Policy. (2019). The 11th Science and Technology Foresight Survey. NISTEP REPORT No. 183. (The latest report from Japan's Delphi survey, which has been conducted roughly every five years since 1971.)
The end
Read next ↓