Research
What Makes a Good Product? Insights from the Latest Research and Practice
Product
Career
Automatically translated from the Japanese original.
Overview
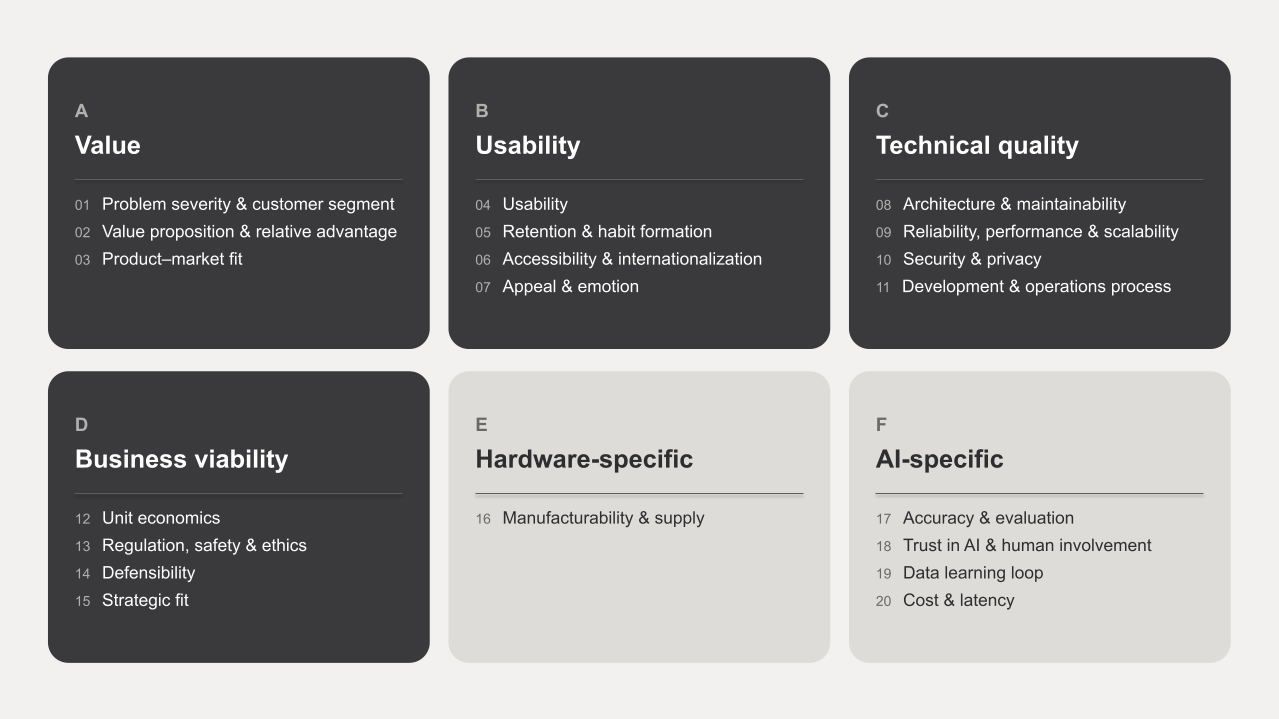
What makes a product good? Academic fields such as quality management, human factors, management science, and innovation studies, together with practitioners who have built products at Apple, Amazon, Nest, and elsewhere, have each defined "goodness" in their own vocabulary. This article draws those perspectives together and breaks a good product down into six conditions and twenty elements: value, usability, technical quality, business viability, conditions specific to hardware, and conditions specific to AI products.
It then organizes the roles of the stakeholders involved—product managers, designers, the various engineering disciplines, and customers—into seven tracks, and lays out, across six phases running from customer problem discovery through to retrospective, which elements are verified by whom, using which methods, and against which target levels, in chronological order.
Introduction
The conditions that make a product "good" have been discussed in different terms by academic disciplines such as quality management, human–computer interaction, and management science on the one hand, and by practitioners who have actually built products on the other. Once you look beyond basic safety and stability to include innovative features, usability, and the ability to sustain a business, there is no sufficiently comprehensive account of what a product must satisfy to be called good. This article, written with both software and hardware in mind, sets out the conditions a good product should meet, and who should verify them, when, and by what means during the course of development.
This article contributes three things that are new.
It integrates academic and practitioner definitions of a good product into six conditions and twenty elements. Academic definitions such as Garvin's (1987) eight dimensions of quality, the Kano model (Kano et al., 1984), and ISO/IEC 25010 (ISO/IEC, 2023) are placed in a single framework alongside practitioner definitions such as Cagan's (2017) four risks, with the differences between software and hardware spelled out element by element. For example, Kano's "attractive quality" and Norman's (2004) "emotional design" are treated as the same element, "appeal and emotion."
It translates this into "who verifies what, when, and how" across six phases. Most of the literature discusses what makes a product good, but stops short of assigning owners and threshold values. Here, for instance, product-market fit is tied to a concrete benchmark—at least 40% of users saying they would be "very disappointed" if the product disappeared (Ellis & Brown, 2017)—measured quarterly by the product manager.
It surveys the latest research and practice. Spanning new product research, HCI, software engineering, organizational theory, and human–AI collaboration, it organizes 19 studies—showing that product advantage is the number one success factor, that more features can actually lower satisfaction, the effects of psychological safety and agile, and the productivity gap created by generative AI—along with 15 practitioner positions from Y Combinator, Jobs, Bezos, Musk, Cagan, Fadell, and others, in the order of value, usability, technology, business viability, and AI. Where practitioners disagree—"customer voice versus vision," or "ship early versus polish first"—both sides of the argument are presented.
What Makes a Good Product
Definitions of a good product
How, then, has a "good product" been defined? Below we summarize how different fields have characterized what makes a product good or bad.
The quality management definition: Garvin (1987) divided product quality into eight dimensions: performance, features, reliability, conformance, durability, serviceability, aesthetics, and perceived quality. He argued that quality is not a single axis; companies compete by choosing the dimensions their customers care about most. In the 1980s, for example, Japanese automakers pulled ahead of their U.S. rivals on the dimensions of reliability and conformance.
The attractive quality definition: Kano et al. (1984) distinguished three types of quality: "must-be quality," which customers take for granted when present; "one-dimensional quality," where satisfaction rises in proportion to how well it is fulfilled; and "attractive quality," whose absence causes no dissatisfaction but whose presence delights. On a smartphone, for example, call quality is must-be quality, battery life is one-dimensional quality, and early fingerprint authentication was attractive quality.
The software engineering definition: ISO/IEC 25010 (ISO/IEC, 2023) defines software product quality through nine characteristics: functional suitability, performance efficiency, compatibility, interaction capability, reliability, security, maintainability, flexibility, and safety. Take two apps with identical features: the one with lower maintainability will cost several times more to modify two years down the line.
The human-centered design definition: ISO 9241-210 (ISO, 2019) specifies "human-centered design"—understanding users' needs and context, involving users in the design, and evaluating iteratively—while Norman (2013) made "affordances" and "signifiers," cues that make it visibly clear how something is used, a condition of good design. A door that gives no clue whether to push or pull may do its job, but it is not well designed.
The innovation research definition: Rogers (2003) identified five attributes that determine how quickly an innovation spreads: relative advantage, compatibility with existing habits, low complexity, trialability, and observability. Davis (1989) explained whether users accept a technology in terms of "perceived usefulness" and "perceived ease of use." QR code payments, for example, spread rapidly because they fit an existing habit (carrying a smartphone), were easy to try, and could be seen in use by others.
The Jobs to be Done definition: Christensen et al. (2016) argued that customers do not "buy" products but "hire" them to make a specific kind of progress in their lives—a "job"—and defined a good product as the one that gets the job done best. The milkshake bought on the morning commute, for instance, is hired for the job of "relieving the boredom of the drive and keeping hunger at bay until lunch."
Practitioner definitions: Cagan (2017) defined a good product as one that has overcome all four risks: value (will customers buy it?), usability (can they figure out how to use it?), feasibility (can we build it?), and business viability (does it work as a business?). Rams (Vitsœ, n.d.) set out ten principles of good design: it is innovative, useful, aesthetic, understandable, unobtrusive, honest, long-lasting, thorough down to the last detail, environmentally friendly, and involves as little design as possible. Apple's original iPod is often cited as the archetypal good product precisely because it cleared all four risks while staying true to Rams's principles.
The product-market fit definition: Andreessen (2007) coined product-market fit (PMF) for the state of "being in a good market with a product that can satisfy that market," calling it the only thing that matters for a startup. Ellis & Brown (2017) proposed a rule of thumb: at least 40% of users answer "very disappointed" to the question "How would you feel if you could no longer use this product?" Superhuman, for example, has publicly documented how it raised this metric from 22% to 58% (Vohra, 2018).
Building on these definitions, the rest of this article breaks a good product down into six conditions and twenty elements.
A. Value: Does it solve a customer problem?
Value arises when customers have a problem they are willing to pay to solve, and the product solves it better than any alternative. In new product research since Cooper & Kleinschmidt (1987), product advantage has consistently ranked as the number one success factor (Henard & Szymanski, 2001; Evanschitzky et al., 2012).
① Problem severity and customer segment
Definition: A specific customer segment has a problem that occurs frequently and is serious enough that they would pay to solve it. The problem is defined not as a feature request but as the progress the customer wants to make—the job (Christensen et al., 2016). The job is not "I want a faster drill" but "I want to put a hole in the wall and hang a shelf," which means a product that hangs shelves without drilling is also a competitor.
How to evaluate: Assess how often the problem occurs, how serious it is (time or money lost), what alternatives customers currently use and how much they pay for them, and how many customers share the problem (segment size). If you can answer "how many times a month does it happen, how many hours are lost each time, and what are they paying for today?", you have quantified the severity of the problem.
Overview: Blank (2013) proposed "customer development"—discovering customers and confirming the problem exists before building the product—and Fitzpatrick (2013) laid out principles for asking about past behavior rather than opinions. Because hardware prototypes take time and money, problem validation for hardware is done first with mock-ups or by modifying existing products (Fadell, 2022). Airbnb's founders, for example, hosted guests in their own apartment to confirm firsthand the problem of "wanting to spend less on lodging but not wanting a cheap hotel," and Nest began by studying what frustrated people about existing thermostats (the hassle of programming them).
② Value proposition and relative advantage
Definition: The product has a clear advantage over existing alternatives for the customer (relative advantage) that can be stated in a single sentence (Rogers, 2003). Value is understood not just as the core function but as the "whole product," including support, compatibility, and surrounding services (Levitt, 1980; Moore, 1991). The value of an electric vehicle, for example, is determined not only by the car itself but by the charging network around it.
How to evaluate: Measure the improvement over alternatives (time, cost, quality), check whether customers can explain in their own words why they use this rather than something else, and classify the product using the Kano model (attractive quality or must-be quality; Witell et al., 2013). A feature that most respondents in a Kano survey say they "could do without" will not differentiate the product.
Overview: Since Cooper & Kleinschmidt (1987), a superior product with unique benefits has remained the single strongest factor separating success from failure. In software, where features are easy to add, advantages are quickly copied; in hardware, physical design and manufacturing know-how preserve an advantage for longer. Dyson's vacuum cleaners, for example, drew a sharp line with a single claim—"no loss of suction"—and sustained that advantage for years on technology developed over 5,127 prototypes (Dyson, 2021).
③ Product-market fit
Definition: Customers value the product so much that they would struggle without it; they keep using it and recommend it to others. Andreessen (2007) observed that when PMF is present, you can feel customers "pulling" the product out of you. After PMF, inquiries rise without any sales effort and server capacity cannot be added fast enough to keep up.
How to assess it: Use the PMF survey that asks users how they would feel if they could no longer use the product (Ellis & Brown, 2017), check whether retention curves flatten out by cohort, track NPS (Reichheld, 2003), and measure conversion to paid plans. For hardware, substitute pre-orders, return rates, reviews, and, for connected devices, usage rates. A connected fitness machine, for example, is better judged by how many times a month buyers actually use it and by subscription churn than by units sold.
Overview: PMF is not a one-time achievement. Olsen (2015) frames it as a five-layer pyramid spanning the market (customers and their problems) and the product (value proposition, features, UX), arguing that when the market shifts, the fit breaks down. Vohra (2018) improved the metric with a two-step process: double down on what "very disappointed" users value most, and resolve the frustrations of those who are only "somewhat disappointed." The rise of smartphones, for instance, caused many services that had achieved PMF on PCs to lose their fit.
B. Usability: Can people use it, and keep using it?
Usability is the condition that allows a valuable product to actually be used—and to go on being used. In Davis's (1989) Technology Acceptance Model, ease of use stands alongside usefulness as one of the two factors that determine intention to use.
④ Usability
Definition: The degree to which specific users can achieve specific goals effectively, efficiently, and with satisfaction (ISO 9241-11; ISO, 2018). Nielsen's (1994) ten heuristics—visibility of system status, match with the real world, error prevention, recognition rather than recall, and so on—serve as criteria for judging a design. An editing screen that gives no indication of whether your work has been saved, for example, violates "visibility of system status."
How to assess it: Measure task completion rates and completion times in small-sample usability tests (Nielsen, 2000), use the System Usability Scale (SUS; Brooke, 1996; Sauro & Lewis, 2016), and watch for multiple people getting stuck at the same point. If you put a new application screen in front of five people and three of them stumble in the same place, that place is a design problem.
Overview: Krug (2014) makes "don't make the user think" the paramount principle, and Norman (2013) argues that the blame for a wrong action belongs not to the user but to the design that invited it. Software can change its UI after release, but a hardware product's physical interface—its buttons, shape, and weight—cannot be changed once it ships, which gives prototype-stage testing far greater weight. Amazon's "1-Click" ordering, for example, is a design that minimizes the number of decisions between the user and the purchase, and Nest reworked the feel of turning its dial again and again during prototyping (Fadell, 2022).
⑤ Continued use and habit formation
Definition: A state in which users reach the core value (the "aha" moment) on first use, come back repeatedly, and make the product part of their habits or daily work. Fogg (2009) explains that behavior occurs when motivation, ability, and a trigger all converge at the same moment, and Eyal (2014) describes how habits are built through a loop of trigger, action, reward, and investment. Slack, for example, determined that a team was hooked once it had exchanged 2,000 messages, and designed its onboarding to lead teams to that point (First Round Review, 2015).
How to assess it: Track the activation rate (the share of sign-ups who reach the core value), retention curves by cohort, DAU/MAU (or weekday usage rates for work tools), and Google's HEART framework (Happiness, Engagement, Adoption, Retention, Task success; Rodden et al., 2010). For hardware, usage frequency is unknowable unless the device is connected, so substitute surveys or the purchase frequency of consumables. Continued use of a coffee maker, for example, is measured by the repurchase rate of its capsules.
Overview: Designing for habit is justified only when it aligns with the user's own interests. Eyal (2014) himself states that habit-forming techniques should not be applied to products that do not improve users' lives. Cranking up notification frequency to boost short-term usage, for example, only drives up churn over the long run.
⑥ Accessibility and internationalization
Definition: A state in which users with visual, auditory, motor, or cognitive limitations, as well as users from different languages, cultures, and legal systems, can all use the product equally well. The W3C's (2023) WCAG 2.2 sets its success criteria under four principles: perceivable, operable, understandable, and robust. A chart that conveys status through color alone, for example, is indistinguishable to users with color vision deficiencies.
How to assess it: Evaluate the WCAG conformance level, operability with assistive technologies such as screen readers, and the range of supported languages, currencies, date formats, and time zones. A screen designed in English, for example, can see its strings grow roughly 1.3 times longer when translated into German, spilling out of their buttons.
Overview: A WebAIM (2024) survey detected WCAG violations on 95.9% of the top one million websites—accessibility is a condition that simply will not be met unless it is designed for deliberately. Software can switch languages and display settings in configuration, but hardware faces region-by-region differences in supply voltage, plug shapes, radio frequency bands, and national certifications (CE, FCC, and so on), so the scope of support has to be decided at the design stage. A device sold in both Japan and the United States, for example, needs its wireless module certified separately in each country.
⑦ Appeal and emotion
Definition: The quality of being not just functional but pleasant to use and desirable to own. Norman (2004) divides the levels at which design works on emotion into three: the "visceral" (appearance), the "behavioral" (the feel of using it), and the "reflective" (meaning and self-image). The attractive quality in the Kano model (Kano et al., 1984) corresponds to this element as well. Apple's product packaging, for example, designs the unboxing experience itself at the visceral level.
How to assess it: Use NPS (Reichheld, 2003), identification of attractive quality through Kano questionnaires, and consistency in design reviews (terminology, color, spacing, motion). If different screens mix terms like "Save," "Register," and "Confirm" for the same action, for example, the product lacks consistency.
Overview: Under Rams's principles (Vitsœ, n.d.), good design is thorough down to the last detail and is as little design as possible, and Jobs argued that you should start with the customer experience and work backwards to the technology, rather than starting with the technology (Jobs, 1997). Beauty also raises perceived usability (Kurosu & Kashimura, 1995; Tractinsky et al., 2000). In hardware, appeal is determined by physical qualities—materials, weight, texture, sound; in software, by responsiveness, motion, and the tone of the copy. The sound of a luxury car's door closing, for example, is a deliberately engineered form of appeal, and the smoothness of an app's screen transitions is its counterpart.
C. Technical quality: Can you build it, and will it keep running?
Technical quality determines not only whether a product can be built once, but whether it can keep being built as requirements continue to change—and whether it keeps running in customers' hands. The quality characteristics of ISO/IEC 25010 (ISO/IEC, 2023) and the empirical research of DORA (Forsgren et al., 2018) form the foundation of this condition.
⑧ Architecture and maintainability
Definition: A structure in which, when a change becomes necessary, its impact is contained and it can be made safely. Parnas (1972) proposed "information hiding"—concealing design decisions likely to change inside modules—and Conway (1968) observed that a system's structure mirrors the communication structure of the organization that built it. If pricing logic is duplicated in three places—the UI, the API, and batch processing—for example, every price change has to be made three times.
How to assess it: Evaluate the scope of impact of changes (module boundaries, direction of dependencies, duplication), lead time for changes, test coverage, and the amount of technical debt relative to the rate at which it is paid down. For hardware, measure the replaceability of parts, modularity, and ease of repair (Ulrich et al., 2020). Framework's laptops, for example, turn a modular structure in which every component can be swapped out into the product's core value.
Overview: Cunningham (1992) likened hastily written code to "debt," warning that unless it is repaid, the interest—ever-rising cost of change—keeps compounding. In a survey by Besker et al. (2019), developers spent an average of 23% of their working time dealing with technical debt. Fowler's (2018) refactoring, a discipline for improving structure without changing behavior, is something to set aside regular time for. Code without tests, for example, keeps paying interest in the form of manual verification on every single change.
⑨ Reliability, performance, and scalability
Definition: The property of continuing to work when customers need it, at the speed they need, even as load increases. Google's SRE practice (Beyer et al., 2016) makes availability targets explicit as "service level objectives" (SLOs) and treats any margin above the target as an "error budget" that can be spent on developing new features. With an SLO of 99.9% monthly availability, for example, about 43 minutes of downtime per month is tolerated; once that is exceeded, stabilization takes priority over new features.
How to assess it: Evaluate SLO attainment, the distribution of response times (e.g., the 95th percentile), how response changes under load, and time to recover from failures. For hardware, measure failure rates (MTBF), durability testing, and the cost of failures within the warranty period (Garvin, 1987). In automobiles, for example, OTA updates can only fix software-related defects; a faulty part means a recall.
Overview: Nygard (2018) catalogued design patterns—timeouts, circuit breakers, bulkheads—that confine failures to a local area. Design on the assumption that failures will happen, and learn from them afterward through blameless postmortems (Beyer et al., 2016). When an external payment API slows down, for example, you need a structure that can pause just the payment step rather than freezing every screen.
⑩ Security and privacy
Definition: A state in which customers' data and assets are protected and privacy is considered from the design stage onward. Cavoukian's (2009) "Privacy by Design" makes protection the default setting rather than an after-the-fact countermeasure, and the OWASP (2021) Top 10 catalogues typical vulnerabilities such as broken access control, cryptographic failures, and injection. A design that puts user IDs in the URL, for example, is a textbook case of broken access control.
How to assess: Check whether countermeasures exist for each threat identified through threat modeling, the severity and number of vulnerabilities found in vulnerability scans and penetration tests, known vulnerabilities in dependent libraries, and whether retention periods and deletion procedures are defined for personal data. For example, if a high-severity vulnerability remains unaddressed, the product cannot ship, no matter how well it meets every other condition.
Overview: NIST's (2022) Secure Software Development Framework is a standard for building these activities into the development process. Software vulnerabilities can be fixed by distributing a patched version, but hardware cannot be fixed after shipping unless it has a means of updating its firmware. The EU's Cyber Resilience Act (European Parliament and Council, 2024b) obliges makers of products with digital elements to provide security updates after sale. IoT devices without a secure update mechanism, for example, are increasingly being restricted from sale altogether.
⑪ Development and operations process
Definition: A working system for delivering to customers in small, frequent, safe increments and learning from the results. Forsgren et al. (2018) demonstrated that four metrics—deployment frequency, lead time for changes, change failure rate, and time to restore service—correlate with organizational performance. High-performing organizations, for example, deploy multiple times a day, have low failure rates, and recover within an hour.
How to assess: Use the four DORA metrics, the degree of CI/CD automation, and whether release retrospectives are held. For hardware, assess whether the product has passed each stage of engineering validation (EVT), design validation (DVT), and production validation (PVT), and whether go/no-go decisions are made at each stage (the stage-gate model of Cooper, 1990). For example, changing the shape of the enclosure after the molds have been ordered causes months of delay and tens of millions of yen in additional cost (Fadell, 2022).
Overview: Brooks (1995) observed that adding people to a late project makes it later, and Singer's (2019) Shape Up showed how to cut the scope of work to fit a fixed six-week cycle. Ries's (2011) build-measure-learn loop and Amazon's "Working Backwards" (Bryar & Carr, 2021), in which the press release and FAQ are written before development begins, are principles for minimizing both the time to learning and wasted development. DORA (2025) reports that while AI use raises throughput, it also increases instability, and that its benefits are amplified in organizations with foundations such as small batches and strict version control. For example, even if AI makes code generation faster, the change failure rate will rise if review and testing cannot keep pace.
D. Business viability: Can it sustain itself as a business?
Business viability determines whether a product that is good for customers is also one its makers can sustain. It is the last of Cagan's (2017) four risks, and here we also treat legal regulation and ethics as conditions for the survival of the business.
⑫ Unit economics
Definition: The revenue from each customer (whether one person, one company, or one unit) exceeds the cost of acquiring that customer and continuing to serve them. Skok (2013) made the ratio of customer lifetime value (LTV) to customer acquisition cost (CAC), along with the CAC payback period, the central metrics for SaaS. For example, a customer paying 10,000 yen a month at an 80% gross margin who stays an average of 30 months has an LTV of 240,000 yen; the business works if CAC falls comfortably below that figure.
How to assess: Use LTV/CAC, CAC payback period, gross margin, churn rate, and net revenue retention (NRR). For hardware, assess gross margin inclusive of bill of materials (BOM) cost, manufacturing, logistics, inventory, returns, and warranty costs. For example, at an NRR of 110%, revenue from existing customers grows 10% a year even with zero new customers.
Overview: The marginal cost of software is close to zero, with cloud costs as the main variable expense, whereas hardware adds physical costs and generally carries lower gross margins. AI products incur inference costs every time they are used, so this element must be considered alongside ⑳. In hardware, for example, a common rule of thumb sets the selling price at several times the BOM cost, with warranty and return costs factored in.
⑬ Regulation, safety, and ethics
Definition: The product meets the regulations that apply to it, causes no harm to users or third parties, and is socially acceptable. The EU AI Act (European Parliament and Council, 2024a) imposes obligations on AI systems according to their level of risk, and the revised Product Liability Directive (European Parliament and Council, 2024c) extended liability to cover software and AI. For example, AI used in hiring or credit decisions is classified as high-risk, making documentation, human oversight, and guaranteed accuracy mandatory.
How to assess: Check how comprehensively the applicable laws have been inventoried (personal data, consumer protection, industry-specific regulation, product safety, export controls), the results of risk assessments, and the status of external audits and certifications. NIST's (2023) AI Risk Management Framework provides a structure for self-assessing AI risks. Before entering a new market, for example, confirm that country's personal data protection law and its restrictions on cross-border data transfer.
Overview: For hardware, product safety certifications (electrical appliances, radio, chemical substances) are a prerequisite for shipping, while for software the focus has been on personal data and cybersecurity regulation; with the Cyber Resilience Act and the revision of the Product Liability Directive, however, software is now being held to product-level liability as well. Ethics reaches further than regulation: as the dark patterns documented by Mathur et al. (2019) show, a design that deceives users erodes trust even when it is legal. In the EU from 2024 onward, for example, damage caused by software defects also falls under product liability.
⑭ Defensibility
Definition: There is a reason the product will keep its customers even when a good product is copied. Defensibility (a moat) comes in five categories: cost structure, customer lock-in, network effects, intangible assets, and market structure. A product deeply embedded in a customer's workflow, for example, is expensive to switch away from, so customers are unlikely to churn even if its features are copied.
How to assess: Look at the size of switching costs, the amount of data accumulated per customer, whether network effects exist (does value rise as users increase?), and how churn changes when a competitor launches equivalent features. For example, if churn does not change after a competitor releases an equivalent feature, the defensibility lies somewhere other than the features.
Overview: For software, defensibility comes mainly from data and network effects; for hardware, it comes mainly from manufacturing know-how, patents, distribution networks, and complementary goods (consumables, accessories). Defensibility does not exist from the start—it is built deliberately after product-market fit. A camera lens mount, for example, is lock-in via complementary goods: the customer's investment in compatible lenses stands in the way of switching.
⑮ Strategic alignment
Definition: Each feature and product is in line with the product vision and strategy, and with the company's goals. Cagan & Jones (2020) advocated "product teams" that own outcomes and decide their own solutions, rather than "feature teams" that work through feature requests. For example, a team given only a revenue target will resort to discounting, while a team given the outcome "raise customer retention" will turn to improving the product.
How to assess: Check whether the product vision and strategy are documented, whether each roadmap item can be explicitly tied to the strategic hypothesis it tests, and whether quarterly outcome objectives (OKRs) are being met. For example, write "the hypothesis this item tests" next to every roadmap item, and remove any item for which nothing can be written.
Overview: Jobs said that focus means deciding what not to do, and Bezos (2017) named customer obsession and vigilance against process becoming an end in itself as conditions of "Day 1." Horowitz (2014) called a good product manager the "CEO of the product," defining the role as one accountable for results. Strategy, for example, is the decision to turn down even a heavily requested feature if it would dilute the product's core value.
E. Conditions specific to hardware
⑯ Manufacturability, supply, and physical quality
Definition: The product can be mass-produced as designed, at the target cost, with consistent quality, and its parts can be sourced reliably. Design for Manufacture and Assembly (DFMA) by Boothroyd et al. (2011) is a method for reducing part counts and simplifying assembly at the design stage, and Taguchi (1986) proposed "robust design," in which performance stays constant despite manufacturing variation. Simply reducing the types of screws from three to one, for example, cuts both assembly time and errors.
How to assess: Use yield and first-pass yield at each prototype stage (EVT, DVT, PVT), the results of durability and environmental testing (temperature, humidity, drop, vibration), the acquisition of safety and radio certifications in each country (CE, FCC, UL, and so on), defect and return rates in early mass production, and the proportion of single-source parts. For example, if yield falls short of target at PVT, the start of mass production must be postponed.
Overview: Part sourcing, lead times, single-source risk, and inventory levels are all determined at the same time as the design (Ulrich et al., 2020). Fadell (2022) says that in hardware you learn with the first generation, fix with the second, and perfect with the third, and advises against aiming for perfection in the first. The software counterparts of this element are reproducible builds and deployments, dependence on cloud vendors, and support for diverse runtime environments (OS, browser, device). For example, a design that depends on a specific semiconductor halts shipment of the entire product when supply stops, and a design that depends on a single cloud provider is its equivalent.
F. Conditions specific to AI products
Products built around AI have properties that conventional software does not: their output is probabilistic, contains errors, and changes with use. In addition to the elements covered so far, the following four are required.
⑰ Accuracy and evaluation
Definition: The AI's output reaches the accuracy required in real usage situations, and that accuracy can be measured in a reproducible way. Stanford HAI's (2025) AI Index points out that many public benchmarks have saturated and that the gap between them and real-world tasks is widening. For example, a model with a high correct-answer rate on general question answering may still make frequent errors when reading documents specific to a particular line of work.
How to assess: Use precision, recall, and tallies by error type on an evaluation dataset built from real data (one that reflects the expected distribution of inputs), agreement rates with human evaluation, and regression tests for every release (Husain, 2024; Zheng et al., 2023). For example, make 100 past real cases the evaluation set, and compare against that same set every time the model or the prompt is changed.
Overview: As Karpathy (2017) put it in coining the term "Software 2.0," the quality of an AI product is determined not by its code but by its data and evaluation. When AI is embedded in hardware (robots, vehicles, medical devices), errors can cause physical harm, so fail-safe design that defaults to the safe side and validation in real-world environments become additional requirements. In autonomous driving, for example, the number of human interventions during real road testing serves as an evaluation metric alongside the distance driven in simulation.
⑱ Trust in AI and human involvement
Definition: A state in which users rely on AI appropriately, neither trusting it too much nor doubting it too much. Amershi et al. (2019) proposed 18 guidelines for human-AI interaction, including making clear what the AI can do and how well it can do it, and making it efficient to correct its mistakes. One example is a design that displays the AI's confidence level and prompts a human check when that confidence is low.
How to evaluate: Measure the rate at which users accept the AI's output when it is right versus when it is wrong (the degree of calibration), the rate of human corrections, the time those corrections take, and conformance with design guidance such as Google's People + AI Guidebook (PAIR, 2019). If, for example, users catch only a small share of the AI's errors, overreliance is occurring.
Overview: Bansal et al. (2021) showed that attaching explanations to AI judgments makes users more likely to follow them even when the AI is wrong, while Buçinca et al. (2021) showed that "cognitive forcing," which prompts users to think for themselves, reduces overreliance. Dell'Acqua et al. (2023) identified a "jagged frontier": on tasks the AI handles well, quality goes up, but on tasks it handles poorly, accuracy goes down. Designing where humans should be involved is therefore what separates good outcomes from bad. For instance, a flow that requires users to review the supporting evidence before approving, rather than a single button that approves the AI's suggestion as-is, reduces the number of errors that slip through.
⑲ The data learning loop
Definition: A state in which the data generated through use feeds back into improving the product. DORA (2025) cites a healthy data ecosystem and access to internal data as capabilities that determine how effective AI is. One example is a design in which the history of users' corrections to AI output becomes the evaluation data and raw material for the next round of improvement.
How to evaluate: Measure the collection rate for correction data, the time from collection to improvement, the change in accuracy after improvement, and the results of audits of data quality and bias. For example, tally correction histories month by month and check whether the same kinds of errors are decreasing.
Overview: The learning loop is also the source of lock-in through accumulated data, one of the components of ⑭ Defensibility. For AI embedded in hardware, the learning loop cannot close without connectivity to retrieve data from the field and a mechanism for distributing updates (OTA). Inspection equipment installed in a factory, for example, needs a channel for retrieving records of false detections, and that channel must be planned at the design stage.
⑳ Cost and response speed
Definition: A state in which the AI's inference costs and response times are commensurate with the price and the user experience. Unlike conventional software, an AI product incurs inference costs every time it is used, which directly affects unit economics. If, for example, a feature that costs tens of yen per run is offered without limits, the product loses more money the more it is used.
How to evaluate: Measure the inference cost per use and its ratio to revenue, the distribution of response times, and the cost savings achieved through model slimming and caching. Nielsen's (1993) three thresholds (0.1 seconds, 1 second, and 10 seconds) serve as a guide for acceptable response times. For example, use a small model for some types of processing and a large model for others, and measure where cost and accuracy balance out.
Overview: AI also changes how fast the people building the product can work, but the effect is not uniform. In an experiment by Peng et al. (2023), users of AI code completion finished a task 55.8% faster, whereas in a randomized controlled trial by METR (2025), experienced developers working in codebases they knew well took 19% longer on average when using AI tools, even though the developers themselves felt they had been faster. The lesson is that AI's impact must be measured not by how it feels but by lead time and change failure rate.
The product development process
Stakeholders
The following section divides the roles involved in product development into seven families. For each family, it gives an overview and then sets out the role of its key stakeholders: the conditions and elements they own, the decisions they have the authority to make, and the metrics they should be checking.
Product roles
Overview: Product managers (responsible for what gets built and for outcomes), product owners (responsible for the backlog in Scrum), and program managers and Scrum masters (keeping work moving and removing obstacles). These roles mainly relate to A (Value), D (Business viability), and ⑪ (Development and operations process). In a small organization, for example, the product manager also serves as product owner and handles progress management.
Product manager: Owns A (Value) and D (Business viability), covering the customer's problem, the value proposition, product-market fit, unit economics, and alignment with strategy. Horowitz (2014) called a good product manager "the CEO of the product" and defined them as someone who takes responsibility for results without making excuses. The metrics to check are the PMF survey, retention rate, LTV/CAC, and OKR attainment. For example, every proposal for a new feature must come with the hypothesis to be tested and the expected change in metrics.
Design roles
Overview: UX and UI designers (designing screens and interactions), UX researchers (studying users), and technical writers (copy, help content, and documentation). These roles mainly relate to B (Ease of use) and ⑱ (Calibrated trust). How the AI's confidence level is displayed, for example, is designed jointly by designers and data/machine learning engineers.
Designer: Owns B (Ease of use), covering usability, the paths that bring users back, accessibility, and appeal and consistency. The metrics to check are task completion rate, SUS, WCAG conformance, and adherence to the design system. For example, run a usability test with five users before each release and share the results with the trio.
Software engineering roles
Overview: Backend, frontend, mobile, infrastructure/SRE, security, data/machine learning, and quality assurance (QA)/test engineers. These roles mainly relate to C (Technical quality) and F (Conditions specific to AI products). SLOs, for example, are defined jointly by backend and SRE, and QA independently verifies the evidence that they are being met.
Backend engineer: Owns ⑧ (Architecture and maintainability), ⑨ (Reliability and performance), and ⑩ (Security), with responsibility for designing the data model and APIs, managing technical debt, and meeting SLOs. The metrics to check are lead time for changes, change failure rate, test coverage, and the number of vulnerabilities. In design reviews, for example, they confirm that the impact of a change is contained within a single module.
Frontend engineer: Owns the technical realization of ④ (Usability) and ⑥ (Accessibility), the perceived-performance aspects of ⑨ (rendering speed and responsiveness), and the implementation of the design system. The metrics to check are rendering speed (such as Core Web Vitals), automated accessibility checks, and the UI defect rate. For example, they automatically measure, with every release, whether the main screens render within the target time.
Infrastructure/SRE engineer: Owns ⑨ (Reliability, performance, and scalability), ⑩ (Security), and ⑪ (Development and operations process), with responsibility for operating SLOs and error budgets, maintaining CI/CD and the internal platform, and handling incidents and postmortems (Beyer et al., 2016). DORA (2025) lists a high-quality internal platform as one of the capabilities that amplify the impact of AI. The metrics to check are SLO attainment, time to recovery, deployment frequency, and cloud costs. For example, once the error budget is exhausted, they have the authority to halt new feature development and redirect effort toward stabilization.
Data/machine learning engineer: Owns F (Conditions specific to AI products), with responsibility for maintaining evaluation datasets, measuring accuracy, designing the learning loop, and managing inference costs. The metrics to check are accuracy on the evaluation set, the rate of human corrections, and inference cost per use. For example, no change to a model or prompt is released without comparative results on the evaluation set.
Quality assurance (QA): Independently verifies, for every condition, whether the target level has been met, and provides the basis for decisions at each stage. The metrics to check are test pass rate, the number of critical defects, and regression test results. At the end of Phase 4, for example, QA presents the evidence that each element has reached its target level.
Hardware engineering roles
Overview: Mechanical design, electrical and electronic design, firmware and embedded software, manufacturing and production engineering, procurement and supply chain, and certification and regulatory compliance. These roles mainly relate to E (Conditions specific to hardware), ⑨ (Reliability), and ⑬ (Regulation and safety). Country-by-country certification of a wireless module, for example, is planned from the design stage by electrical design together with the certification lead.
Hardware engineer (mechanical, electrical, manufacturing): Owns ⑯ (Manufacturability, supply, and physical quality), with responsibility for DFMA, component sourcing, validation at each prototyping stage, and obtaining certifications. The metrics to check are yield, BOM cost, failure rate, and certification status. At the end of DVT, for example, they make the call to freeze the production form factor and bill of materials.
Business roles
Overview: Sales, customer success and support, marketing, legal and compliance, and finance. These roles mainly relate to A (Value), ⑫ (Unit economics), and ⑬ (Regulation, safety, and ethics). Reasons for churn, for example, are fed back from customer success to the product manager every month.
Sales and customer success: The channel through which customers' problems and complaints flow back into the product, and the source of information for A (Value) and ⑫ (Unit economics). The metrics to check are reasons for churn, onboarding time, and the number of support inquiries by type. For example, they report the reasons given by churned customers to the trio every month.
External stakeholders
Overview: Customers (treating buying decision-makers and frontline users separately), design partners (customers who help with evaluation in the early stages), partners and suppliers, and regulators and certification bodies. They are primarily a source of information for A (Value), and they also impose the constraints in ⑬ and ⑯. In B2B, for example, what buying decision-makers care about (⑫ and ⑬) differs from what frontline users care about (④ and ⑤), so both groups need to be heard.
Customers (design partners): The source of problems and the validators of solutions. Early customers are explicitly given the role of "design partners," taking part in regular interviews and evaluations of prototypes (Blank, 2013). For example, a monthly review session might be held with the first five customer companies to gather their feedback from the prototype stage onward.
Leadership
Overview: Executives and founders, directors and investors. Primarily involved in ⑮ (strategic alignment), ⑫ (unit economics), ⑭ (defensibility) and resource allocation. For example, executives set outcome targets each quarter and leave individual solutions to the trio (Cagan & Jones, 2020).
Executives and founders: Responsible for product vision and strategy, setting outcome targets and allocating resources, while leaving decisions on individual solutions to the trio (Cagan & Jones, 2020). The metrics they track are OKR attainment, PMF, unit economics and regulatory risk. For example, they set outcome targets each quarter but do not dictate features.
The development process
The 20 elements are not meant to be satisfied all at once; they are fulfilled one by one through repeated cycles of discovery and validation. Below, the development flow is divided into six phases, and for each phase the elements to confirm are listed in chronological order, together with the responsible stakeholders, the validation method and the threshold for success.
Phase 1: Discovering customer problems
This phase corresponds to Blank's (2013) customer development and Torres's (2021) continuous discovery: before building anything, we confirm that the problem exists and how severe it is.
① Problem severity and customer segment
Stakeholders: Product manager, customers (design partners), and sales/customer success.
Validation method: Conduct customer interviews that ask about past behavior (Fitzpatrick, 2013) on an ongoing basis, at least once a week (Torres, 2021), and quantify how often the problem occurs, how much time it consumes and how much customers pay to deal with it.
Threshold: At least 20 interviews in the target segment. At least 60% of customers raise the same problem unprompted. The problem occurs at least once a week. For at least 80% of customers, you have established what they currently pay for, or how much time they spend on, their existing workaround (manual work, existing tools).
⑮ Strategic alignment
Stakeholders: Product manager and executives.
Validation method: Cross-check against the strategy document and outcome targets (OKRs) (Cagan & Jones, 2020).
Threshold: The strategic hypothesis this initiative tests is written in a single sentence. At least one quarterly outcome target it contributes to has been identified, and the expected change in the target metric (e.g., a 5-point improvement in retention) is stated numerically.
⑬ Regulation, safety and ethics
Stakeholders: Product manager and executives (for hardware, the person responsible for certification and regulatory compliance).
Validation method: An inventory of applicable laws and regulations and a risk assessment (NIST, 2023).
Threshold: A completed inventory of applicable laws and regulations (personal data, consumer protection, industry-specific regulation, product safety, AI regulation), with no regulation left without an assigned owner. A completed determination of whether the product falls into the high-risk category under risk classification schemes such as the EU AI Act (European Parliament and Council, 2024a). Proposed countermeasures documented for 100% of items rated high-risk in the risk assessment.
⑭ Defensibility
Stakeholders: Product manager and executives.
Validation method: Estimation of switching costs and analysis of competitors.
Threshold: At least one reason customers would stay if the product were copied (switching costs, accumulated data, network effects, complementary goods) has been defined, along with at least one leading indicator of its strength (e.g., volume of accumulated data per customer, number of integrated systems). A comparison table exists for at least three major competitors covering whether they offer equivalent features and at what price.
Phase 2: Product concept
This is the phase where Cagan's (2017) four risks are validated with prototypes before anything is built. For hardware, validation is done with mockups and parallel prototyping (Dow et al., 2010) before committing to tooling.
② Value proposition and relative advantage
Stakeholders: Product manager and designer.
Validation method: A comparison table against alternatives, a Kano survey (Witell et al., 2013) and interviews using the prototype. Because product advantage is the most influential of all success factors (Cooper & Kleinschmidt, 1987), the magnitude of improvement is expressed in numbers.
Threshold: At least 70% of customers who saw the prototype can explain in their own words why they would use it instead of other means. The core feature is classified as an attractive or one-dimensional quality in the Kano survey. The improvement over alternatives is clearly defined on a key metric (e.g., cutting task time by 50% or more).
④ Usability
Stakeholders: Designer and product manager.
Validation method: Usability tests with around five participants (Nielsen, 2000), run several times as the prototype is refined.
Threshold: A completion rate of at least 80% for key tasks (the average reported by Sauro & Lewis, 2016 is 78%). Iterate on fixes until there are no remaining issues where two or more participants stumble at the same point. Time to complete key tasks is shorter than with the current alternative.
⑫ Unit economics
Stakeholders: Product manager and executives.
Validation method: Price-acceptance interviews and cohort-based projections of revenue and costs.
Threshold: At the assumed price and cost, LTV/CAC is 3 or higher and the CAC payback period is within 12 months (Skok, 2013). In price-acceptance interviews, fewer than 30% of respondents say the assumed price is "too expensive." For hardware, the gross margin including BOM cost, manufacturing and logistics meets the target (e.g., 40% or higher).
⑯ Manufacturability and supply
Stakeholders: Hardware engineers (mechanical, electrical, manufacturing) and procurement.
Validation method: DFMA review (Boothroyd et al., 2011) and confirmation of component procurement lead times.
Threshold: Targets for part count and assembly time have been set, and a proposal exists to reduce the part count by at least 20% from the initial design. All single-source components have been identified, and 100% of them have an alternative or an inventory policy. Procurement lead times for key components fall within the buffer in the mass-production plan (e.g., four weeks).
⑰ Accuracy and evaluation
Stakeholders: Data/machine learning engineers and product manager.
Validation method: Build an evaluation set from past real-world cases and confirm inter-rater agreement for human evaluation. If automated evaluation is used, confirm its agreement with human evaluation (Zheng et al., 2023).
Threshold: An evaluation set that reflects the distribution of real data, with at least 30 cases for each major error type. Inter-rater agreement for human evaluation of at least 80%. The required level of accuracy (e.g., a critical error rate below 1%) and the response if it is not met are documented.
Phase 3: Product design
This is the phase where modifiability, reliability, security and accessibility are secured through design before building. The earlier problems are discovered, the more development time and quality improve (Thomke & Fujimoto, 2000).
⑧ Architecture and maintainability
Stakeholders: Backend engineers.
Validation method: Design review (module boundaries, direction of dependencies, duplication) (Parnas, 1972).
Threshold: Of the anticipated change scenarios (around five), at least 80% have an impact confined to a single module. Zero circular dependencies between modules. A plan exists to reserve 10–20% of development time for paying down technical debt (Besker et al., 2019 report that losses due to debt amount to roughly 23% of development time).
⑨ Reliability, performance and scalability
Stakeholders: Backend engineers, infrastructure/SRE engineers and hardware engineers.
Validation method: Documenting SLOs, reviewing the design for failure tolerance (Nygard, 2018), and planning load tests.
Threshold: For each key feature, an SLO (e.g., 99.9% availability, 95th-percentile response time within 1 second) and an error budget (about 43 minutes per month at 99.9% availability) are documented (Beyer et al., 2016). For hardware, a target annual failure rate (e.g., below 1%) and the conditions (temperature, humidity, drop, vibration) and sample sizes for durability and environmental testing have been decided.
⑩ Security and privacy
Stakeholders: Backend engineers and infrastructure/SRE engineers (or the security lead, if there is one).
Validation method: Threat modeling and a design review based on the OWASP Top 10 (OWASP, 2021; Cavoukian, 2009).
Threshold: 100% of high-risk threats identified in threat modeling have countermeasures reflected in the design. 100% of personal data fields have a defined retention period and deletion procedure. Design-level countermeasures are documented for each item in the OWASP Top 10.
⑥ Accessibility and internationalization
Stakeholders: Designer and frontend engineers (for hardware, the person responsible for certification and regulatory compliance).
Validation method: Accessibility checks on the design and an inventory of regional requirements (W3C, 2023).
Threshold: At the design stage, all WCAG 2.2 Level AA success criteria (e.g., a text contrast ratio of at least 4.5:1) are met (W3C, 2023). For each target region, a requirements table covering language, currency, date format, power supply and wireless certification is complete.
⑱ Trust in AI and human involvement
Stakeholders: Data/machine learning engineers and designer.
How to verify: Check conformance against the guidelines of Amershi et al. (2019) and the PAIR (2019) guidebook.
Bar to clear: The design surfaces a confidence level or supporting evidence alongside AI output, and the product conforms to 100% of the applicable items among the 18 guidelines of Amershi et al. (2019). Every process that requires human verification has been identified, and a target has been set for the time needed to verify and correct each item (e.g., within 30 seconds per item).
⑳ Cost and response speed
Stakeholders: Data/machine learning engineers and infrastructure/SRE engineers.
How to verify: Estimate cost and response time for each type of processing, and design how different models will be assigned to different tasks.
Bar to clear: Inference cost per use has been estimated for each type of processing, and the ratio of inference cost to revenue falls within the target (e.g., under 20%). A response-time target has been defined for each type of processing based on Nielsen's (1993) three thresholds (0.1 seconds, 1 second, and 10 seconds)—for example, interactive processing completes within 10 seconds, and anything longer displays progress along the way.
Phase 4: Building and Verifying the Product
This is the phase where you build in small, frequent increments and verify at every step. In hardware, tooling and component orders are locked in at each of the engineering validation (EVT), design validation (DVT), and production validation (PVT) stages, so you make an explicit go/no-go decision at each stage, much like Cooper's (1990) stage-gate process (Fadell, 2022).
⑪ Development and operations process
Stakeholders: Infrastructure/SRE engineers and all engineers.
How to verify: Continuously measure the four metrics of deployment frequency, lead time for changes, change failure rate, and time to restore service (Forsgren et al., 2018; DORA, 2025).
Bar to clear: Performance at the level of the top-tier group in DORA (2024): on-demand deployment frequency (multiple times per day), lead time for changes under one day, a change failure rate of 5% or less, and recovery from a failed deployment in under one hour. The change failure rate must not have worsened after adopting AI (DORA, 2025).
④ Usability
Stakeholders: Front-end engineers and designers.
How to verify: Post-implementation usability testing (Nielsen, 2000), SUS measurement (Sauro & Lewis, 2016), and automated Core Web Vitals measurement built into CI (Walton, 2020).
Bar to clear: A completion rate of 90% or higher on key tasks. An SUS score of 68 or above (the average; Sauro & Lewis, 2016), and ideally 80 or above. Core Web Vitals of LCP within 2.5 seconds, INP within 200 milliseconds, and CLS of 0.1 or below (Walton, 2020).
⑥ Accessibility and internationalization
Stakeholders: Front-end engineers and designers (for hardware, those responsible for certification and regulatory compliance).
How to verify: Build automated accessibility checks (WCAG-compliant testing tools) into CI; confirm operation with assistive technologies (screen readers and keyboard-only navigation); and check the display for each target region (language, currency, and date formats). For hardware, confirm the power specifications and wireless certification requirements of each target region using prototypes.
Bar to clear: Zero WCAG 2.2 AA violations in automated checks (W3C, 2023). A 100% completion rate on key tasks using a screen reader and keyboard-only navigation. 100% of the items in the per-region requirements table created in Phase 3 confirmed in the implementation.
⑨ Reliability and performance
Stakeholders: Back-end engineers, infrastructure/SRE engineers, and hardware engineers.
How to verify: Load testing and fault-injection testing (taking dependencies offline) (Nygard, 2018). For hardware, durability and environmental testing (temperature, humidity, drop, and vibration) plus accelerated life testing.
Bar to clear: At twice the anticipated peak load, 95th-percentile response time stays within the SLO and the error rate stays below 0.1%. When a dependency goes down, the system degrades gracefully and recovers automatically. For hardware, a 100% pass rate in durability and environmental testing, and an estimated failure rate from accelerated life testing below the target (e.g., under 1% per year).
⑩ Security
Stakeholders: Back-end engineers and infrastructure/SRE engineers.
How to verify: Vulnerability assessments, penetration testing, and automated scanning of dependency libraries (NIST, 2022).
Bar to clear: Zero unresolved vulnerabilities of "high" severity or above from vulnerability assessments and penetration tests. Zero unresolved known vulnerabilities in dependency libraries (with remediation deadlines set for "medium" severity and below). Security checks run in CI 100% of the time.
⑯ Manufacturability and supply
Stakeholders: Hardware engineers and manufacturing/procurement staff.
How to verify: Evaluate the prototypes at each of the EVT, DVT, and PVT stages, and measure first-pass yield (the share of units that pass on the first attempt).
Bar to clear: At EVT, 100% of the specified core functions are confirmed to work. At DVT, the production form factor and bill of materials are frozen, and subsequent design changes converge to zero. At PVT, first-pass yield on the production line reaches the target (e.g., 95% or higher), assembly time is within the target, and certifications (safety, electromagnetic compatibility, and wireless) have been obtained.
⑰ Accuracy and evaluation
Stakeholders: Data/machine learning engineers and QA.
How to verify: Run automated evaluation against the evaluation set on every release, and periodically cross-check it against human evaluation (Zheng et al., 2023).
Bar to clear: Accuracy on the evaluation set meets or exceeds the target, and key metrics drop by no more than one point before and after any change to the model or prompts. Agreement between automated and human evaluation is 80% or higher (the level reported by Zheng et al., 2023). Evaluation is run on 100% of releases.
⑲ Data learning loop
Stakeholders: Data/machine learning engineers.
How to verify: Measure the capture rate of correction data.
Bar to clear: A mechanism for recording user corrections is implemented for 100% of the main output types. The capture rate of correction data (the share of corrections that actually get recorded) is 90% or higher. Collected data is added to the evaluation set within one month.
Phase 5: Operating and Measuring the Product
This is the post-launch phase, where you measure whether value is actually being created. Use AARRR (McClure, 2007) and HEART (Rodden et al., 2010) as your measurement frameworks, and confirm the impact of each initiative with A/B testing (Kohavi et al., 2020). For the One Metric That Matters (OMTM) at each stage of growth, see our separate article "The OMTM and KPIs Startups and New Ventures Should Hit at Each Stage."
③ Product-market fit
Stakeholders: Product managers.
How to verify: PMF surveys, cohort analysis, and NPS (Reichheld, 2003). For hardware, substitute return rates and reviews, or—for connected devices—active-use rates.
Bar to clear: 40% or more of users say they would be "very disappointed" if they could no longer use the product (Ellis & Brown, 2017). The cohort retention curve flattens within three to six months. NPS is positive (although, because NPS alone has limited predictive power, it should be used alongside retention; Keiningham et al., 2007). For hardware, the return rate is within the target (e.g., under 3%) and the average review rating is 4 or higher out of 5.
⑤ Ongoing use and habit formation
Stakeholders: Product managers and designers.
How to verify: Measure the activation rate, the retention curve, and the five HEART metrics.
Bar to clear: The activation rate (the share of users who reach the core value experience after signing up) meets the target (e.g., 40% or higher). Monthly retention matches or improves on the previous cohort. Of the five HEART metrics, task success rate and return rate meet their targets (Rodden et al., 2010).
⑨ Reliability and performance
Stakeholders: Infrastructure/SRE engineers.
How to verify: SLO monitoring and incident postmortems (Beyer et al., 2016).
Bar to clear: Monthly SLO attainment meets or exceeds the target (e.g., 99.9% availability), with less than 100% of the error budget consumed. Postmortems are conducted for 100% of major incidents, and 90% or more of the recurrence-prevention measures are completed by their deadlines.
⑫ Unit economics
Stakeholders: Product managers, executives, and sales/customer success.
How to verify: Aggregate revenue and costs by cohort.
Bar to clear: Actual LTV/CAC of 3 or higher, a CAC payback period of 12 months or less, and net revenue retention of 100% or higher (Skok, 2013). For hardware, the gross margin, including warranty and return costs, meets the target (e.g., 40% or higher).
⑲ Data learning loop
Stakeholders: Data/machine learning engineers.
How to verify: Aggregate the correction history, compare accuracy before and after each improvement, and audit the data for bias.
Bar to clear: A correction-data capture rate of 90% or higher. The incidence of the same type of error declines month over month (e.g., a 30% reduction per quarter). Before-and-after accuracy comparisons are recorded for every improvement, and a data bias audit is conducted at least once per quarter.
⑳ Cost and response speed
Stakeholders: Infrastructure/SRE engineers and data/machine learning engineers.
How to verify: Continuously measure cost and response time, and measure the effect of assigning different models to different tasks.
Bar to clear: The ratio of inference cost to revenue stays within the target (e.g., under 20%). 95th-percentile response time stays within the target for each type of processing. The cost savings achieved by assigning different models to different tasks are being measured.
Phase 6: Review and Improvement
This is the stage where measurement results are fed back into the next round of planning. In software, the cycle runs on a weekly or quarterly cadence; in hardware, it runs once per product generation (Fadell, 2022).
⑪ Development and Operations Process
Stakeholders: infrastructure/SRE engineers and all engineers.
Verification method: release retrospectives and regular measurement of the four metrics.
Target level: the quarterly trend in the four metrics is flat or improving (moving toward the level of the top-performing group in DORA, 2024). At least 80% of the improvement actions agreed in retrospectives are actually implemented.
⑧ Architecture and Maintainability
Stakeholders: backend engineers.
Verification method: a technical debt inventory and tracking of change lead time over time (Besker et al., 2019).
Target level: the technical debt inventory is updated at least once per quarter. 10–20% of development time is actually spent paying down debt (at least 80% of what was planned). Change lead time has not worsened compared with the previous quarter.
⑭ Defensibility
Stakeholders: product managers and executives.
Verification method: tracking competitor moves and comparing churn rates.
Target level: in the quarter following a competitor's launch of an equivalent feature, churn rises by no more than one percentage point. Leading indicators of defensibility (the volume of accumulated data, the number of integrated systems) are higher than in the previous quarter.
⑮ Alignment with Strategy
Stakeholders: product managers and executives.
Verification method: OKR retrospectives (checking hypotheses against results, in the manner of the scientific approach described by Camuffo et al., 2020).
Target level: the achievement rate for quarterly key results meets the target (e.g., 70% or higher; 100% is not expected, because the objectives are deliberately ambitious). For every hypothesis that was not borne out, a decision to reject or revise it is recorded (100% documentation rate).
⑬ Regulation, Safety, and Ethics
Stakeholders: product managers and executives.
Verification method: regular updates to the regulatory inventory, plus external audits.
Target level: the regulatory inventory is updated at least once a year, and without exception (100%) before expanding into any new market or use case. 100% of external audit findings are resolved within their deadlines.
⑯ Manufacturability and Supply
Stakeholders: hardware engineers and product managers.
Verification method: analysis of defect and return rates during early mass production (Fadell, 2022).
Target level: defect and return rates in the first three months after the start of mass production are within target. The top three causes of defects and returns are reflected in the design changes for the second generation.
③ Product-Market Fit
Stakeholders: product managers.
Verification method: regular PMF surveys and cohort analysis (Olsen, 2015).
Target level: a PMF survey is run at least once per quarter, and the share of respondents who would be "very disappointed" stays at 40% or above. Retention has not worsened compared with the same period of the previous year.
Current Trends in Research and Practice
Current Trends in Research
Product advantage comes first: Cooper & Kleinschmidt (1987) analyzed roughly 200 new products and showed that a superior product offering unique benefits is the single strongest factor separating success from failure. In a meta-analysis of 60 studies, Henard & Szymanski (2001) reported that product advantage, market potential, meeting customer needs, the quality of pre-development planning, and the commitment of development resources are consistently associated with success, and the updated meta-analysis by Evanschitzky et al. (2012) confirmed the effects of product advantage and market orientation. In practice, sales muscle and advertising can supplement the effect of a superior product, but they cannot substitute for it.
More features is not better: Thompson et al. (2005) demonstrated experimentally that while consumers choose feature-rich products before purchase, once they start using them, satisfaction falls as the feature count rises, and so does intention to repurchase, a phenomenon they called "feature fatigue." This research explains, for example, why a product that wins the feature-count battle on a comparison chart can end up being described as "hard to use" once it ships.
Delighters become expected over time: Witell et al. (2013), summarizing 30 years of research on the Kano model, note that the "life cycle of quality attributes," in which attractive quality migrates over time into one-dimensional quality and then into must-be quality, has been confirmed repeatedly. The smartphone camera, for example, moved from a delighter to a basic expectation, and today image quality is contested as a one-dimensional attribute.
Beauty raises perceived usability: Kurosu & Kashimura (1995) found, using ATM screens, that ratings of visual appeal and ratings of ease of use are strongly correlated, and Tractinsky et al. (2000) replicated this, confirming that a beautiful screen is perceived as easier to use even when actual usability is identical. Given two application screens with the same functionality, for example, the better-organized one is rated as "clearer," and users are more patient with it.
User participation is linked to system success: Bano & Zowghi (2015) systematically reviewed 87 studies on the relationship between user participation and success in system development and reported that the great majority found a positive relationship. For example, projects in which users are involved from the requirements-definition stage onward see less rework during acceptance testing.
Factors that explain technology acceptance: UTAUT (Venkatesh et al., 2003), which integrates Davis's (1989) Technology Acceptance Model, reported that four factors—performance expectancy, effort expectancy, social influence, and facilitating conditions—explain roughly 70% of the variance in intention to use and actual usage behavior. When rolling out a business system, for example, adoption hinges not only on ease of use but also on the social influence of seeing managers and colleagues using it and on the facilitating condition of a solid support structure.
Empirical evidence on software development: Forsgren et al. (2018) showed, through several years of surveys, that four metrics—deployment frequency, lead time, change failure rate, and time to restore—are linked to organizational performance. DORA (2024) reported that increased AI use was associated with a 1.5% drop in throughput and a 7.2% drop in stability, and DORA (2025) reports that throughput has since turned around while instability continues to grow. The research suggests, for example, that AI adoption should proceed only after the foundations of small batches and version control are in place.
The effect of agile: Serrador & Pinto (2015) analyzed 1,002 projects and showed that the greater the degree of agile adoption, the higher the project success in terms of both efficiency and stakeholder satisfaction. Shepherd & Gruber (2021), on the other hand, sorted the components of the Lean Startup into those that have been empirically validated and those that have not, arguing that we should ask about the effect of each individual practice rather than the name of the method. A team that adopts only the sprint rituals without increasing its contact with customers, for example, will not see the benefits the research describes.
The cost of technical debt: Besker et al. (2019) reported that developers spend an average of 23% of their working time dealing with technical debt. On a five-person team, for example, that works out to more than one full-time person's effort perpetually consumed by interest payments on debt.
Psychological safety and team performance: Edmondson (1999) showed that "psychological safety"—the belief that one will not be punished for reporting failures—improves team learning behavior and performance, and Google's internal research (Rozovsky, 2015), analyzing 180 teams, reported that psychological safety was the strongest predictor of team effectiveness. The SRE principle of blameless postmortems after incidents (Beyer et al., 2016), for example, is consistent with this research.
Productivity cannot be captured by a single metric: the SPACE framework of Forsgren et al. (2021) frames developer productivity along five dimensions—satisfaction, performance, activity, communication, and efficiency—and warns of the danger of measuring it with a single activity metric such as commit count. If AI increases the number of lines of code but time spent waiting for review grows, for example, productivity has not improved.
The effect of a scientific approach: the randomized controlled trial by Camuffo et al. (2020) and the large-scale replication by Camuffo et al. (2024) showed that training in stating and testing explicit hypotheses leads to earlier exits from unpromising ventures and higher revenue. Even within the same Lean Startup method, for example, a team that writes down and tests its hypotheses gets different results from one that simply iterates on prototypes.
Front-loaded problem solving and parallel prototyping: Thomke & Fujimoto (2000) showed, using Toyota's development data, that front-loading the discovery and resolution of problems to the early stages of development improves both development time and quality, and Dow et al. (2010) showed experimentally that prototyping several alternatives in parallel leads to better designs and broader exploration than refining a single alternative sequentially. For a hardware enclosure, for example, prototyping three candidates at once and comparing them before cutting tooling produces better results than fixing one design five times over.
The reality of online experimentation: drawing on the experience of running vast numbers of A/B tests at Microsoft and Bing, Kohavi et al. (2020) reported that only about one-third of changes intended as improvements actually improved the key metric, and laid out how to design trustworthy experiments. Even for an idea that "is obviously going to be better," for example, more than half the time it has no effect or makes things worse, so the discipline of measuring before rolling out is essential.
Human–AI collaboration: Bansal et al. (2021) showed that AI explanations can increase users' overreliance, while Buçinca et al. (2021) showed that interventions prompting users to think reduce it. The UI of an AI product, for example, does not become safer merely by adding explanations; it needs to be designed to elicit verification from the user.
Generative AI and productivity: Brynjolfsson et al. (2025) report that generative AI assistance in customer support increased the number of issues resolved by 14% on average, and by 34% for less experienced agents, while it made almost no difference for seasoned staff. Peng et al. (2023) found that developers using AI code completion finished a programming task 55.8% faster, and Dell'Acqua et al. (2023), in an experiment with consultants, describe a "jagged frontier": on tasks suited to AI, quality rose by 40%, but on tasks it handles poorly, accuracy fell by 19 percentage points. METR (2025) reports that when experienced developers used AI on codebases they knew well, their work took 19% longer. The lesson is that the effect of AI can be positive or negative depending on the type of work and the skill of the person using it, so it has to be measured on your own company's actual tasks.
Evaluating AI: Zheng et al. (2023) showed that using a strong language model as an evaluator agrees with human raters about 80% of the time, roughly the same rate at which humans agree with one another. Stanford HAI (2025) points out that many public benchmarks have become saturated and are drifting ever further from real-world tasks. Taken together, these two studies suggest a practice of running automated evaluation on your own evaluation set as a regression test on every release, and periodically cross-checking it against human evaluation.
Dark patterns and accessibility in practice: Mathur et al. (2019) automatically analyzed roughly 11,000 shopping sites and found that about 11% contained "dark patterns" designed to deceive users. WebAIM (2024) reports that 95.9% of the home pages of the top one million websites had automatically detectable WCAG violations. The minimum bar, then, is to check any design intended to boost retention against a published taxonomy to make sure it is not a dark pattern, and to build automated accessibility checks into your CI pipeline.
The limits of NPS: Keiningham et al. (2007) tested the claim that NPS (Net Promoter Score) predicts company growth better than other customer satisfaction metrics and were unable to confirm any such advantage. The research therefore suggests using NPS not as a standalone growth predictor but in combination with retention rates and the reasons customers give for churning.
The latest thinking from practitioners
On value: Y Combinator's motto "Make something people want" (Graham, 2013), Bezos's (2017) "customer obsession," and Jobs's (1997) principle of starting with the customer experience and working backwards to the technology all place A (value) at the very top. Amazon, for instance, institutionalized the customer's perspective by placing an empty chair in meetings to represent the customer (Bryar & Carr, 2021).
The voice of the customer or the founder's vision? Blank (2013) and Torres (2021) emphasize learning from customers, while Jobs observed that people often don't know what they want until you show it to them (Jobs, 1998). The division of labor between the two views is this: learn the problem from customers, and let the makers conceive and test the solution. Customers may ask for "a faster horse," but the underlying problem, wanting to get around faster, is real; the solution (the automobile) is something the makers have to envision.
On usability and appeal: Krug's (2014) "Don't make me think," Rams's (Vitsœ, n.d.) "as little design as possible," and Google's (n.d.) "Focus on the user and all else will follow" are all principles of B (usability). The white space on Google's search page is the physical embodiment of this principle.
Adding features or taking them away? The Kano model emphasizes adding attractive quality; Rams and Musk emphasize subtraction. Musk laid out a sequence: question the requirements, delete parts and process steps, simplify, speed up, and only then automate, warning never to automate before you have deleted (Everyday Astronaut, 2021). The two views do not contradict each other; it is a question of timing. Add only features that deliver attractive quality, and simplify those that have become must-be quality. In practice, every proposal for a new feature should come with a note on what will be removed in exchange, and the retirement of unused features should be reviewed on a regular schedule.
On technical quality: Brooks's (1995) observation that adding people to a late project makes it later, Beyer et al.'s (2016) error budgets, and Fadell's (2022) rule that it takes three generations to get a product right all treat C (technical quality) as a matter of managing constraints rather than pursuing an ideal. An error budget, for example, is a mechanism that settles the tension between stability and new features with a number.
Operating for both speed and quality: Singer's (2019) Shape Up fits work into fixed six-week cycles, Bryar & Carr's (2021) Working Backwards starts from the press release and works in reverse, and Beyer et al.'s (2016) SRE uses error budgets to strike the balance between new features and stability. As the research of Forsgren et al. (2018) shows, speed and stability are not a trade-off: the same investments (small batches, automation) raise both. Shipping every two weeks and watching the response, rather than releasing three months' worth of features at once, shortens the time you can spend heading in the wrong direction.
Ship early, or polish first? Hoffman & Yeh (2018) argue that if you're not embarrassed by your first release, you shipped too late, and Graham (2013) recommends "doing things that don't scale," such as recruiting and supporting early customers by hand. On the other hand, physical products need iteration before release: Dyson (2021) went through 5,127 prototypes before launching. The practical split is to release software early to a limited audience, and for hardware to run as many prototype iterations as possible, as fast as possible.
Go and see for yourself: Toyota's "genchi genbutsu" (Liker, 2004) makes it a principle to verify facts on the ground rather than through reports, and Torres's (2021) continuous discovery calls for a fixed habit of several customer interviews every week. Vohra (2018) published a procedure for categorizing the free-text responses to a PMF survey to set improvement priorities. For early customers, for example, the founders themselves handle onboarding and learn the customers' problems in the process.
On business viability and strategy: Horowitz's (2014) view that a good product manager is the CEO of the product and owns its results, Cagan & Jones's (2020) "product teams, not feature teams," and Bezos's (2017) warning against process becoming an end in itself all treat D (business viability) as a question of outcomes rather than individual features. A team given an outcome such as retention, for instance, is judged on retention, not on the number of features it ships.
Moving to the product operating model: Cagan (2024) systematized the shift from "feature teams," which work through requested features in order, to "product teams," which own outcomes, as the "product operating model," and spelled out how executives, product leaders, and teams each need to change their behavior. The first step is to replace the roadmap, which lists features, with quarterly outcome targets and a list of hypotheses to test.
How founders should stay involved: Drawing on the experience of Airbnb's Chesky, Graham (2024) proposed "founder mode," in which founders engage directly with the details, as a counterpoint to "manager mode," which emphasizes delegation, sparking debate among practitioners. The point of contention is its tension with Cagan & Jones's (2020) principle of leaving solutions to the team. Even if founders do get involved in the details of the product, the deciding factor is whether they do so without breaking the discipline of outcome targets and validation.
How AI is changing development: Karpathy (2017) proposed "Software 2.0," in which code written by humans is replaced by trained models, and argued that the developer's job would shift from writing code to curating data. DORA (2025) reports that AI amplifies an organization's strengths and weaknesses alike. Even if AI speeds up code generation, for example, the change failure rate will rise if review and testing cannot keep pace.
Put evaluation at the center of AI products: Husain (2024) argues that the success or failure of an AI product hinges on whether you can build an evaluation system grounded in real data, and recommends treating evaluation as the equivalent of requirements definition. This is consistent with the research of Zheng et al. (2023) and Stanford HAI (2025). In practice, it means never releasing a change to a model or a prompt without first comparing it on your own evaluation set.
What hardware practitioners have in common: Fadell's (2022) "it takes three generations," Dyson's (2021) prototype iterations, Musk's subtraction process (Everyday Astronaut, 2021), and Toyota's genchi genbutsu (Liker, 2004) all agree on one point: with physical products, quality is determined by how many prototypes you build, how fast you build them, and how many parts and process steps you eliminate. For a first-generation device, for example, you narrow the feature set and plan from the outset to feed what you learn into the second generation.
Drawing the line between habit-forming design and ethics: Eyal (2014) offers a framework for judging whether habit-forming design can be justified, based on two questions: would the makers use it themselves, and does it improve users' lives? Google (PAIR, 2019) and Microsoft (Amershi et al., 2019) have published design guidelines for AI products. In response to the prevalence of dark patterns documented by Mathur et al. (2019), regulation such as the EU's AI Act (European Parliament and Council, 2024a) now adds further constraints on design. The test for any measure intended to improve retention, then, is whether you could explain it to your users.
Closing thoughts
This article has broken down what makes a good product into six conditions and twenty elements, and set out who verifies what, and to what standard, at each Phase of development. The numerical targets are meant as guidelines, to be replaced with figures that reflect each company's own track record. We hope it serves as a comprehensive checklist, whether you are conceiving a new product or taking stock of an existing one.
References
Amershi, S., Weld, D., Vorvoreanu, M., Fourney, A., Nushi, B., Collisson, P., Suh, J., Iqbal, S., Bennett, P. N., Inkpen, K., Teevan, J., Kikin-Gil, R., & Horvitz, E. (2019). Guidelines for human-AI interaction. Proceedings of the 2019 CHI Conference on Human Factors in Computing Systems, Paper 3. Summary: Microsoft researchers distilled more than 150 design recommendations into 18 guidelines and validated them through user studies. The guidelines include making clear what the AI can do and making it efficient for users to correct its mistakes.
Andreessen, M. (2007). The only thing that matters. pmarchive. https://pmarchive.com/guide_to_startups_part4.html Summary: An essay that defines product-market fit as the single factor that separates successful startups from failed ones, describing it as "being in a good market with a product that can satisfy that market."
Bano, M., & Zowghi, D. (2015). A systematic review on the relationship between user involvement and system success. Information and Software Technology, 58, 148–169. Summary: A systematic review of 87 studies on the relationship between user involvement and the success of system development, reporting that the large majority found a positive relationship.
Bansal, G., Wu, T., Zhou, J., Fok, R., Nushi, B., Kamar, E., Ribeiro, M. T., & Weld, D. (2021). Does the whole exceed its parts? The effect of AI explanations on complementary team performance. Proceedings of the 2021 CHI Conference on Human Factors in Computing Systems, Article 81. Summary: Experiments showing that attaching explanations to an AI's judgments makes users more likely to go along with it even when it is wrong, so that explanations do not necessarily improve the results of human-AI collaboration.
Besker, T., Martini, A., & Bosch, J. (2019). Software developer productivity loss due to technical debt: A replication and extension study examining developers' development work. Journal of Systems and Software, 156, 41–61. Summary: Based on work logs from 43 developers, this study found that an average of 23% of working time was spent dealing with technical debt.
Beyer, B., Jones, C., Petoff, J., & Murphy, N. R. (Eds.). (2016). Site reliability engineering: How Google runs production systems. O'Reilly Media. Summary: A book compiling Google's SRE practices. It presents the idea of using service level objectives (SLOs) and error budgets to decide, in quantitative terms, how to balance reliability against new feature development.
Bezos, J. (2017). 2016 letter to shareholders. Amazon. Summary: A shareholder letter naming the conditions for staying in "Day 1": obsessing over customers, resisting the tendency for process to become an end in itself, embracing external trends, and making decisions quickly.
Blank, S. (2013). The four steps to the epiphany: Successful strategies for products that win (2nd ed.). K&S Ranch. Summary: The book that proposed the "customer development" model of discovering and validating customers in parallel with product development, laying the groundwork for the lean startup movement.
Boothroyd, G., Dewhurst, P., & Knight, W. A. (2011). Product design for manufacture and assembly (3rd ed.). CRC Press. Summary: A textbook that systematized DFMA, a methodology for reducing part counts and simplifying assembly at the design stage.
Brooke, J. (1996). SUS: A "quick and dirty" usability scale. In P. W. Jordan, B. Thomas, B. A. Weerdmeester, & I. L. McClelland (Eds.), Usability evaluation in industry (pp. 189–194). Taylor & Francis. Summary: Proposed the System Usability Scale (SUS), which rates usability on a 0–100 scale using a 10-item questionnaire.
Brooks, F. P. (1995). The mythical man-month: Essays on software engineering (Anniversary ed.). Addison-Wesley. Summary: A classic on managing software development, including Brooks's law: "adding manpower to a late software project makes it later."
Bryar, C., & Carr, B. (2021). Working backwards: Insights, stories, and secrets from inside Amazon. St. Martin's Press. Summary: Two former Amazon executives explain the company's mechanisms, including Working Backwards (starting from a press release and FAQ), single-threaded leaders, and the empty chair for the customer.
Brynjolfsson, E., Li, D., & Raymond, L. (2025). Generative AI at work. The Quarterly Journal of Economics, 140(2), 889–942. Summary: An empirical study showing that generative AI assistance in customer support raised the number of issues resolved by 14% on average, with the largest gains among less experienced agents.
Buçinca, Z., Malaya, M. B., & Gajos, K. Z. (2021). To trust or to think: Cognitive forcing functions can reduce overreliance on AI in AI-assisted decision-making. Proceedings of the ACM on Human-Computer Interaction, 5(CSCW1), Article 188. Summary: Experiments showing that "cognitive forcing" interventions, such as requiring users to form their own judgment before seeing the AI's suggestion, reduce overreliance on AI.
Cagan, M. (2017). Inspired: How to create tech products customers love (2nd ed.). Wiley. Summary: Frames the conditions for a good product as four risks—value, usability, feasibility, and business viability—and advocates product discovery: validating these before building.
Cagan, M. (2024). Transformed: Moving to the product operating model. Wiley. Summary: Systematizes the shift from feature teams to product teams accountable for outcomes as the "product operating model," and walks through the steps of that transformation.
Cagan, M., & Jones, C. (2020). Empowered: Ordinary people, extraordinary products. Wiley. Summary: Contrasts "feature teams," which work through requested features, with "product teams," which are accountable for outcomes and decide their own solutions, and discusses the leadership needed to make the latter a reality.
Camuffo, A., Cordova, A., Gambardella, A., & Spina, C. (2020). A scientific approach to entrepreneurial decision making: Evidence from a randomized control trial. Management Science, 66(2), 564–586. Summary: Randomly assigning 116 startups to groups, this study showed that founders trained in a scientific approach—stating hypotheses explicitly and testing them—abandoned unpromising ventures sooner and earned higher revenue.
Camuffo, A., Gambardella, A., Messinese, D., Novelli, E., Paolucci, E., & Spina, C. (2024). A scientific approach to entrepreneurial decision-making: Large-scale replication and extension. Strategic Management Journal, 45(6), 1209–1237. Summary: A replication of the 2020 experiment scaled up to 759 companies, confirming that the effects of the scientific approach hold up.
Cavoukian, A. (2009). Privacy by design: The 7 foundational principles. Information and Privacy Commissioner of Ontario. Summary: Sets out seven principles for building privacy in from the design stage, including being proactive rather than reactive and protecting privacy by default.
Christensen, C. M., Hall, T., Dillon, K., & Duncan, D. S. (2016). Competing against luck: The story of innovation and customer choice. HarperBusiness. Summary: Explains the Jobs to be Done theory—that customers "hire" a product to get a specific job done—through cases such as the milkshake example.
Conway, M. E. (1968). How do committees invent? Datamation, 14(4), 28–31. Summary: The paper that introduced "Conway's law": the structure of a system mirrors the communication structure of the organization that designs it.
Cooper, R. G. (1990). Stage-gate systems: A new tool for managing new products. Business Horizons, 33(3), 44–54. Summary: Proposes the stage-gate method, which divides new product development into stages separated by gates, with a go/kill decision made at each gate.
Cooper, R. G., & Kleinschmidt, E. J. (1987). New products: What separates winners from losers? Journal of Product Innovation Management, 4(3), 169–184. Summary: An analysis of roughly 200 new products showing that a superior product offering unique benefits is the single strongest factor separating successes from failures.
Cunningham, W. (1992). The WyCash portfolio management system. OOPSLA '92 Addendum to the Proceedings, 29–30. Summary: The report that first introduced the "technical debt" metaphor, likening hastily written code to a loan whose interest keeps growing unless it is paid back.
Davis, F. D. (1989). Perceived usefulness, perceived ease of use, and user acceptance of information technology. MIS Quarterly, 13(3), 319–340. Summary: Proposes the Technology Acceptance Model (TAM), which explains whether users adopt a technology in terms of its perceived usefulness and perceived ease of use.
Dell'Acqua, F., McFowland, E., Mollick, E. R., Lifshitz-Assaf, H., Kellogg, K., Rajendran, S., Krayer, L., Candelon, F., & Lakhani, K. R. (2023). Navigating the jagged technological frontier: Field experimental evidence of the effects of AI on knowledge worker productivity and quality (Harvard Business School Working Paper 24-013). Summary: An experiment with 758 consultants revealing a "jagged frontier": on tasks where AI excels, quality rises, but on tasks outside its strengths, accuracy falls.
DORA. (2024). Accelerate State of DevOps Report 2024. Google Cloud. Summary: Based on a survey of roughly 39,000 people, reports that increased AI use was associated with a 1.5% drop in throughput and a 7.2% drop in stability.
DORA. (2025). 2025 DORA Report: State of AI-assisted software development. Google Cloud. Summary: Based on a survey of roughly 5,000 people, reports that AI improves throughput while increasing instability, that AI amplifies an organization's existing strengths and weaknesses, and identifies seven capabilities that determine its impact.
Dow, S. P., Glassco, A., Kass, J., Schwarz, M., Schwartz, D. L., & Klemmer, S. R. (2010). Parallel prototyping leads to better design results, more divergence, and increased self-efficacy. ACM Transactions on Computer-Human Interaction, 17(4), Article 18. Summary: Experimentally demonstrates that prototyping several alternatives in parallel produces better designs and broader exploration than refining a single idea step by step.
Dyson, J. (2021). Invention: A life. Simon & Schuster. Summary: The autobiography of Dyson's founder, including the story of how the cyclonic vacuum cleaner was perfected over 5,127 prototypes.
Edmondson, A. (1999). Psychological safety and learning behavior in work teams. Administrative Science Quarterly, 44(2), 350–383. Summary: Shows that psychological safety, the belief that one will not be punished for reporting failures, enhances team learning behavior and performance.
Ellis, S., & Brown, M. (2017). Hacking growth: How today's fastest-growing companies drive breakout success. Crown Business. Summary: Proposes as a benchmark for product-market fit that at least 40% of users answer "very disappointed" when asked how they would feel if they could no longer use the product, and explains how to run growth experiments.
European Parliament and Council. (2024a). Regulation (EU) 2024/1689 laying down harmonised rules on artificial intelligence (Artificial Intelligence Act). Official Journal of the European Union. Summary: An EU regulation that classifies AI systems by level of risk and requires high-risk applications to meet obligations including documentation, human oversight, and assured accuracy and robustness.
European Parliament and Council. (2024b). Regulation (EU) 2024/2847 on horizontal cybersecurity requirements for products with digital elements (Cyber Resilience Act). Official Journal of the European Union. Summary: An EU regulation requiring products with digital elements to be secure by design and to receive security updates after they are sold.
European Parliament and Council. (2024c). Directive (EU) 2024/2853 on liability for defective products. Official Journal of the European Union. Summary: A revised EU directive extending product liability to software and AI systems, making it easier to claim compensation for harm caused by defective digital products.
Evanschitzky, H., Eisend, M., Calantone, R. J., & Jiang, Y. (2012). Success factors of product innovation: An updated meta-analysis. Journal of Product Innovation Management, 29(S1), 21–37. Summary: Updates the Henard & Szymanski (2001) meta-analysis and confirms that product advantage and market orientation remain strongly linked to new product success.
Everyday Astronaut. (2021). Starbase tour with Elon Musk [Part 1] [Video]. YouTube. Summary: An interview in which Musk lays out his five-step process for design and manufacturing: question the requirements, delete, simplify, accelerate, and automate.
Eyal, N. (2014). Hooked: How to build habit-forming products. Portfolio. Summary: Presents a model in which habits form through a four-stage loop of trigger, action, reward, and investment, and also addresses how to apply it ethically.
Fadell, T. (2022). Build: An unorthodox guide to making things worth making. Harper Business. Summary: The creator of the iPod and Nest explains why hardware takes three generations to get right, how to approach prototyping and staged validation (EVT, DVT, PVT), and how to build teams.
First Round Review. (2015). From 0 to $1B: Slack's founder shares their epic launch strategy. First Round Review. Summary: An article in which Slack founder Butterfield describes the benchmark that a team sticks with the product once it has exchanged 2,000 messages, and how the early launch was handled.
Fitzpatrick, R. (2013). The mom test: How to talk to customers and learn if your business is a good idea when everyone is lying to you. CreateSpace. Summary: A practical guide built on the principle that customer interviews should ask about specific past behavior rather than opinions or promises about the future.
Fogg, B. J. (2009). A behavior model for persuasive design. Proceedings of the 4th International Conference on Persuasive Technology, Article 40. Summary: Proposes the Fogg Behavior Model, which holds that a behavior occurs only when motivation, ability, and a trigger all come together at the same moment.
Forsgren, N., Humble, J., & Kim, G. (2018). Accelerate: The science of lean software and DevOps. IT Revolution. Summary: Drawing on several years of research, shows that four metrics (deployment frequency, lead time for changes, change failure rate, and time to restore service) are linked to software delivery performance and organizational outcomes.
Forsgren, N., Storey, M.-A., Maddila, C., Zimmermann, T., Houck, B., & Butler, J. (2021). The SPACE of developer productivity: There's more to it than you think. ACM Queue, 19(1), 20–48. Summary: Proposes the SPACE framework, which captures developer productivity across five dimensions: satisfaction, performance, activity, communication, and efficiency.
Fowler, M. (2018). Refactoring: Improving the design of existing code (2nd ed.). Addison-Wesley. Summary: A book cataloguing refactoring techniques for improving the internal structure of code without changing its externally observable behavior.
Garvin, D. A. (1987). Competing on the eight dimensions of quality. Harvard Business Review, 65(6), 101–109. Summary: Breaks product quality down into eight dimensions—performance, features, reliability, conformance, durability, serviceability, aesthetics, and perceived quality—and argues that companies must choose which of these dimensions to compete on.
Google. (n.d.). Ten things we know to be true. https://about.google/philosophy/ Summary: Google's ten guiding principles, headed by "Focus on the user and all else will follow."
Graham, P. (2013). Do things that don't scale. http://paulgraham.com/ds.html Summary: An essay arguing that early-stage startups should deliberately do things that don't scale, such as recruiting and supporting customers by hand.
Graham, P. (2024). Founder mode. http://paulgraham.com/foundermode.html Summary: An essay that contrasts "manager mode," which emphasizes delegation, with "founder mode," in which founders stay directly involved in the details.
Henard, D. H., & Szymanski, D. M. (2001). Why some new products are more successful than others. Journal of Marketing Research, 38(3), 362–375. Summary: A meta-analysis of 60 empirical studies showing that product advantage, market potential, meeting customer needs, pre-development planning, and dedicated development resources are consistently associated with new product success.
Hoffman, R., & Yeh, C. (2018). Blitzscaling: The lightning-fast path to building massively valuable companies. Currency. Summary: Lays out strategies for hypergrowth and the case for shipping imperfect products early, including the maxim "If you're not embarrassed by the first version, you've launched too late."
Horowitz, B. (2014). The hard thing about hard things: Building a business when there are no easy answers. HarperBusiness. Summary: Includes the 1996 internal memo "Good Product Manager / Bad Product Manager," which frames the product manager as the CEO of the product.
Husain, H. (2024). Your AI product needs evals. https://hamel.dev/blog/posts/evals/ Summary: A practitioner's article arguing that improving an AI product requires an evaluation system grounded in real data, and explaining how to build one.
ISO. (2018). ISO 9241-11:2018 Ergonomics of human-system interaction — Part 11: Usability: Definitions and concepts. International Organization for Standardization. Summary: The international standard that defines usability as the extent to which specified users can achieve specified goals with effectiveness, efficiency, and satisfaction.
ISO. (2019). ISO 9241-210:2019 Ergonomics of human-system interaction — Part 210: Human-centred design for interactive systems. International Organization for Standardization. Summary: The international standard that specifies the human-centred design process, built on the principles of understanding users and their context, involving users, and iterating through evaluation.
ISO/IEC. (2023). ISO/IEC 25010:2023 Systems and software engineering — Systems and software Quality Requirements and Evaluation (SQuaRE) — Product quality model. International Organization for Standardization. Summary: The international standard that defines software product quality in terms of nine characteristics: functional suitability, performance efficiency, compatibility, interaction capability, reliability, security, maintainability, flexibility, and safety.
Jobs, S. (1997). Closing keynote Q&A at the 1997 Worldwide Developers Conference. Apple. Summary: The Q&A session in which Jobs stated that "you've got to start with the customer experience and work backwards to the technology."
Jobs, S. (1998). Steve Jobs: "There's sanity returning" [Interview]. BusinessWeek. Summary: An interview in which Jobs remarked that "a lot of times, people don't know what they want until you show it to them," describing an approach to product development that does not rely on customer research.
Karpathy, A. (2017). Software 2.0. Medium. Summary: Introduces the idea of "Software 2.0," in which human-written code is replaced by the learned weights of a model, and argues that developers' work will shift toward curating data.
Keiningham, T. L., Cooil, B., Andreassen, T. W., & Aksoy, L. (2007). A longitudinal examination of net promoter and firm revenue growth. Journal of Marketing, 71(3), 39–51. Summary: Tests the claim that NPS predicts growth better than other customer metrics and reports that no such superiority could be confirmed.
Kohavi, R., Tang, D., & Xu, Y. (2020). Trustworthy online controlled experiments: A practical guide to A/B testing. Cambridge University Press. Summary: Explains how to design large-scale A/B tests and avoid their pitfalls, and reports that only a fraction of changes intended to improve a product actually do.
Krug, S. (2014). Don't make me think, revisited: A common sense approach to web usability (3rd ed.). New Riders. Summary: A practical guide to web and app usability whose foremost principle is that users should never have to think.
Kurosu, M., & Kashimura, K. (1995). Apparent usability vs. inherent usability: Experimental analysis on the determinants of the apparent usability. CHI '95 Conference Companion on Human Factors in Computing Systems, 292–293. Summary: Using ATM screens, demonstrates a strong correlation between how attractive users rate an interface and how easy to use they judge it to be.
Levitt, T. (1980). Marketing success through differentiation—of anything. Harvard Business Review, 58(1), 83–91. Summary: Frames product value in layers—the generic product, the expected product, the augmented product, and the potential product—and argues that differentiation happens at the augmented layer.
Liker, J. K. (2004). The Toyota way: 14 management principles from the world's greatest manufacturer. McGraw-Hill. Summary: Explains Toyota's 14 management principles, including genchi genbutsu (go and see for yourself to verify the facts on the ground).
Mathur, A., Acar, G., Friedman, M. J., Lucherini, E., Mayer, J., Chetty, M., & Narayanan, A. (2019). Dark patterns at scale: Findings from a crawl of 11K shopping websites. Proceedings of the ACM on Human-Computer Interaction, 3(CSCW), Article 81. Summary: An automated analysis of roughly 11,000 shopping websites that found dark patterns designed to deceive users on about 11% of them.
McClure, D. (2007). Startup metrics for pirates: AARRR! 500 Hats. Summary: The presentation that proposed the AARRR framework, organizing startup metrics into five stages: acquisition, activation, retention, referral, and revenue.
METR. (2025). Measuring the impact of early-2025 AI on experienced open-source developer productivity. Model Evaluation & Threat Research. Summary: A randomized controlled trial with 16 experienced open-source developers, reporting that using AI tools made tasks take 19% longer on average, even though the developers felt they had become faster.
Moore, G. A. (1991). Crossing the chasm: Marketing and selling high-tech products to mainstream customers. HarperBusiness. Summary: Argues that crossing the chasm between early adopters and the mainstream market requires a "whole product" that delivers everything customers expect.
Nielsen, J. (1993). Response times: The 3 important limits. Nielsen Norman Group. https://www.nngroup.com/articles/response-times-3-important-limits/ Summary: Identifies three thresholds in how users perceive response times: 0.1 seconds (feels instantaneous), 1 second (the user's flow of thought stays uninterrupted), and 10 seconds (the limit for keeping the user's attention).
Nielsen, J. (1994). Enhancing the explanatory power of usability heuristics. Proceedings of the SIGCHI Conference on Human Factors in Computing Systems, 152–158. Summary: Sets out ten heuristics for usability evaluation, including visibility of system status and error prevention.
Nielsen, J. (2000). Why you only need to test with 5 users. Nielsen Norman Group. Summary: Argues that because five users uncover the majority of usability problems, repeated rounds of small-scale testing are more efficient than one large study.
NIST. (2022). Secure Software Development Framework (SSDF) version 1.1 (NIST SP 800-218). National Institute of Standards and Technology. Summary: A framework for building security practices into every stage of the software development process.
NIST. (2023). Artificial Intelligence Risk Management Framework (AI RMF 1.0). National Institute of Standards and Technology. Summary: A voluntary framework that addresses AI risk through four functions: govern, map, measure, and manage.
Norman, D. A. (2004). Emotional design: Why we love (or hate) everyday things. Basic Books. Summary: Describes three levels at which design works on our emotions: visceral, behavioral, and reflective.
Norman, D. A. (2013). The design of everyday things (Revised and expanded ed.). Basic Books. Summary: The revised edition of a classic that lays out principles for designs whose use is self-evident, including affordances, signifiers, and feedback.
Nygard, M. T. (2018). Release it! Design and deploy production-ready software (2nd ed.). Pragmatic Bookshelf. Summary: Catalogs design patterns such as timeouts, circuit breakers, and bulkheads that contain failures locally so systems keep running in production.
Olsen, D. (2015). The lean product playbook: How to innovate with minimum viable products and rapid customer feedback. Wiley. Summary: Frames product-market fit as a five-layer pyramid spanning the market (customers, problems) and the product (value proposition, features, UX), and walks through the steps for achieving it.
OWASP. (2021). OWASP Top 10: 2021. Open Worldwide Application Security Project. Summary: Compiles the ten most critical security risks for web applications, including broken access control, cryptographic failures, and injection.
PAIR. (2019). People + AI guidebook. Google. Summary: Google's guidance for designing human-centered AI products, covering how to define user needs, collect data, calibrate trust, and handle errors.
Parnas, D. L. (1972). On the criteria to be used in decomposing systems into modules. Communications of the ACM, 15(12), 1053–1058. Summary: Proposes "information hiding"—keeping design decisions that are likely to change inside a module—as the criterion for splitting a system into modules.
Peng, S., Kalliamvakou, E., Cihon, P., & Demirer, M. (2023). The impact of AI on developer productivity: Evidence from GitHub Copilot. arXiv. https://arxiv.org/abs/2302.06590 Summary: Reports that in a randomized experiment on a programming task, participants using AI code completion finished 55.8% faster.
Reichheld, F. F. (2003). The one number you need to grow. Harvard Business Review, 81(12), 46–54. Summary: Introduces the Net Promoter Score (NPS), measured with the single question of how likely one is to recommend the product to a friend or colleague, and shows its correlation with growth.
Ries, E. (2011). The lean startup: How today's entrepreneurs use continuous innovation to create radically successful businesses. Crown Business. Summary: Advocates the "build-measure-learn" loop, in which hypotheses are tested with a minimum viable product (MVP).
Rodden, K., Hutchinson, H., & Fu, X. (2010). Measuring the user experience on a large scale: User-centered metrics for web applications. Proceedings of the SIGCHI Conference on Human Factors in Computing Systems, 2395–2398. Summary: Proposes Google's HEART framework, which measures user experience along five dimensions: happiness, engagement, adoption, retention, and task success.
Rogers, E. M. (2003). Diffusion of innovations (5th ed.). Free Press. Summary: Identifies five attributes that determine how quickly an innovation spreads: relative advantage, compatibility, complexity, trialability, and observability.
Rozovsky, J. (2015). The five keys to a successful Google team. Google re:Work. Summary: An account of internal research at Google that, based on an analysis of 180 teams, found psychological safety to be the strongest predictor of team effectiveness.
Sauro, J., & Lewis, J. R. (2016). Quantifying the user experience: Practical statistics for user research (2nd ed.). Morgan Kaufmann. Summary: A guide to the statistical treatment of user research data, including the finding that the average SUS score is 68.
Serrador, P., & Pinto, J. K. (2015). Does Agile work? A quantitative analysis of agile project success. International Journal of Project Management, 33(5), 1040–1051. Summary: Analyzes 1,002 projects and shows that the degree of agile adoption is positively associated with both project efficiency and stakeholder satisfaction.
Shepherd, D. A., & Gruber, M. (2021). The lean startup framework: Closing the academic–practitioner gap. Entrepreneurship Theory and Practice, 45(5), 967–998. Summary: A review that maps each element of the lean startup approach onto existing research, sorting out which claims are empirically supported and which remain untested.
Singer, R. (2019). Shape Up: Stop running in circles and ship work that matters. Basecamp. Summary: Explains Basecamp's development method, in which work is scoped down to fit a fixed six-week cycle and handed to a dedicated team.
Skok, D. (2013). SaaS metrics 2.0: A guide to measuring and improving what matters. For Entrepreneurs. Summary: A practitioner's guide that sets out benchmarks for SaaS metrics, such as an LTV/CAC ratio of 3 or higher and a CAC payback period of 12 months or less.
Stanford HAI. (2025). Artificial Intelligence Index Report 2025. Stanford Institute for Human-Centered Artificial Intelligence. Summary: An annual report on technical, economic, and policy trends in AI. It notes that many public benchmarks have become saturated and that the gap between them and real-world tasks is widening.
Taguchi, G. (1986). Introduction to quality engineering: Designing quality into products and processes. Asian Productivity Organization. Summary: Explains robust design, in which performance stays constant despite manufacturing variation, and quality engineering, which treats quality in terms of a loss function.
Thomke, S., & Fujimoto, T. (2000). The effect of "front-loading" problem-solving on product development performance. Journal of Product Innovation Management, 17(2), 128–142. Summary: Uses the case of Toyota to show that shifting problem discovery and resolution to the early stages of development improves both lead time and quality.
Thompson, D. V., Hamilton, R. W., & Rust, R. T. (2005). Feature fatigue: When product capabilities become too much of a good thing. Journal of Marketing Research, 42(4), 431–442. Summary: Demonstrates experimentally the phenomenon of "feature fatigue": consumers choose feature-rich products before purchase, but their satisfaction drops once they use them.
Torres, T. (2021). Continuous discovery habits: Discover products that create customer value and business value. Product Talk. Summary: Advocates continuous discovery habits in which a product trio talks with customers every week and organizes hypotheses using an opportunity solution tree.
Tractinsky, N., Katz, A. S., & Ikar, D. (2000). What is beautiful is usable. Interacting with Computers, 13(2), 127–145. Summary: Replicates Kurosu & Kashimura (1995) and confirms that attractive interfaces are perceived as easier to use even when their actual usability is the same.
Ulrich, K. T., Eppinger, S. D., & Yang, M. C. (2020). Product design and development (7th ed.). McGraw-Hill. Summary: The standard textbook on the product development process, primarily for hardware, systematically covering every stage from concept development through to manufacturing.
Venkatesh, V., Morris, M. G., Davis, G. B., & Davis, F. D. (2003). User acceptance of information technology: Toward a unified view. MIS Quarterly, 27(3), 425–478. Summary: Proposes UTAUT, a model that unifies the major theories of technology acceptance, and reports that performance expectancy, effort expectancy, social influence, and facilitating conditions together explain roughly 70% of the variance in intention to use.
Vitsœ. (n.d.). The power of good design: Dieter Rams's ideology, engrained within Vitsœ. https://www.vitsoe.com/gb/about/good-design Summary: The official explanation of Dieter Rams's "Ten Principles of Good Design."
Vohra, R. (2018). How Superhuman built an engine to find product market fit. First Round Review. Summary: An article laying out the process Superhuman used to raise the share of users who would be "very disappointed" without the product from 22% to 58%.
W3C. (2023). Web Content Accessibility Guidelines (WCAG) 2.2. World Wide Web Consortium. Summary: The W3C recommendation that sets out success criteria for web content accessibility, organized under four principles: perceivable, operable, understandable, and robust.
Walton, P. (2020). Web Vitals. web.dev. https://web.dev/articles/vitals Summary: Defines LCP, INP, and CLS as the core metrics for measuring the web user experience, setting the thresholds for a "good" rating at 2.5 seconds, 200 milliseconds, and 0.1 or below, respectively.
WebAIM. (2024). The WebAIM Million: The 2024 report on the accessibility of the top 1,000,000 home pages. https://webaim.org/projects/million/ Summary: Reports the results of automated testing of the home pages of the top one million websites, finding WCAG failures on 95.9% of them.
Witell, L., Löfgren, M., & Dahlgaard, J. J. (2013). Theory of attractive quality and the Kano methodology – the past, present, and future. Total Quality Management & Business Excellence, 24(11–12), 1241–1252. Summary: A review of 30 years of research on the Kano model, consolidating findings such as the way attractive quality attributes shift over time into must-be quality.
Zheng, L., Chiang, W.-L., Sheng, Y., Zhuang, S., Wu, Z., Zhuang, Y., Lin, Z., Li, Z., Li, D., Xing, E. P., Zhang, H., Gonzalez, J. E., & Stoica, I. (2023). Judging LLM-as-a-judge with MT-Bench and Chatbot Arena. Advances in Neural Information Processing Systems, 36. Summary: Shows that using a strong language model as an evaluator agrees with human evaluators about 80% of the time, on par with the level of agreement between humans themselves.
Kano, N., Seraku, N., Takahashi, F., & Tsuji, S. (1984). Attractive quality and must-be quality [in Japanese]. Hinshitsu (Quality), 14(2), 147–156. Summary: The original paper proposing the Kano model, which distinguishes between must-be quality, one-dimensional quality, attractive quality, and other categories.
The end
Read next ↓