
Articles
Guidelines for Enterprise Process Automation
Product
Career
Automatically translated from the Japanese original.
Introduction
How should digital transformation (DX) and business-process automation be approached—with what mindset, and through what process? Companies are tackling it in all sorts of ways, and executives and the people in charge are no doubt asking themselves whether their approach is really the right one.
These guidelines start from the elements that determine a company's ultimate goal—maximizing corporate value—and then show, through formulas, concrete actions, and case studies (fictional examples), how decomposing and automating business operations improves that value.
Finally, we lay out the practical steps in brief.
1. The Three Levers of Corporate Value
The objective function a company should maximize is corporate value (Value, ). Corporate value is "the sum of the money a company will earn in the future, discounted for how certain that money is," and is defined as follows (the DCF method). (Koller et al., 2020; Damodaran, 2012)
In the numerator, is the projected figure for year : the expected value (E) of the free cash flow (FCF)—the money the company will be free to use that year. In the denominator, is the discount rate (the rate used to convert future money into today's value). It rises the more a company's results fluctuate—in other words, the higher its risk (Risk, ). (Sharpe, 1964)
If we assume that profit (Profit, ) keeps growing every year at a constant rate (Growth, ), the formula reduces to the following simple form (the constant-growth model). (Gordon, 1959)
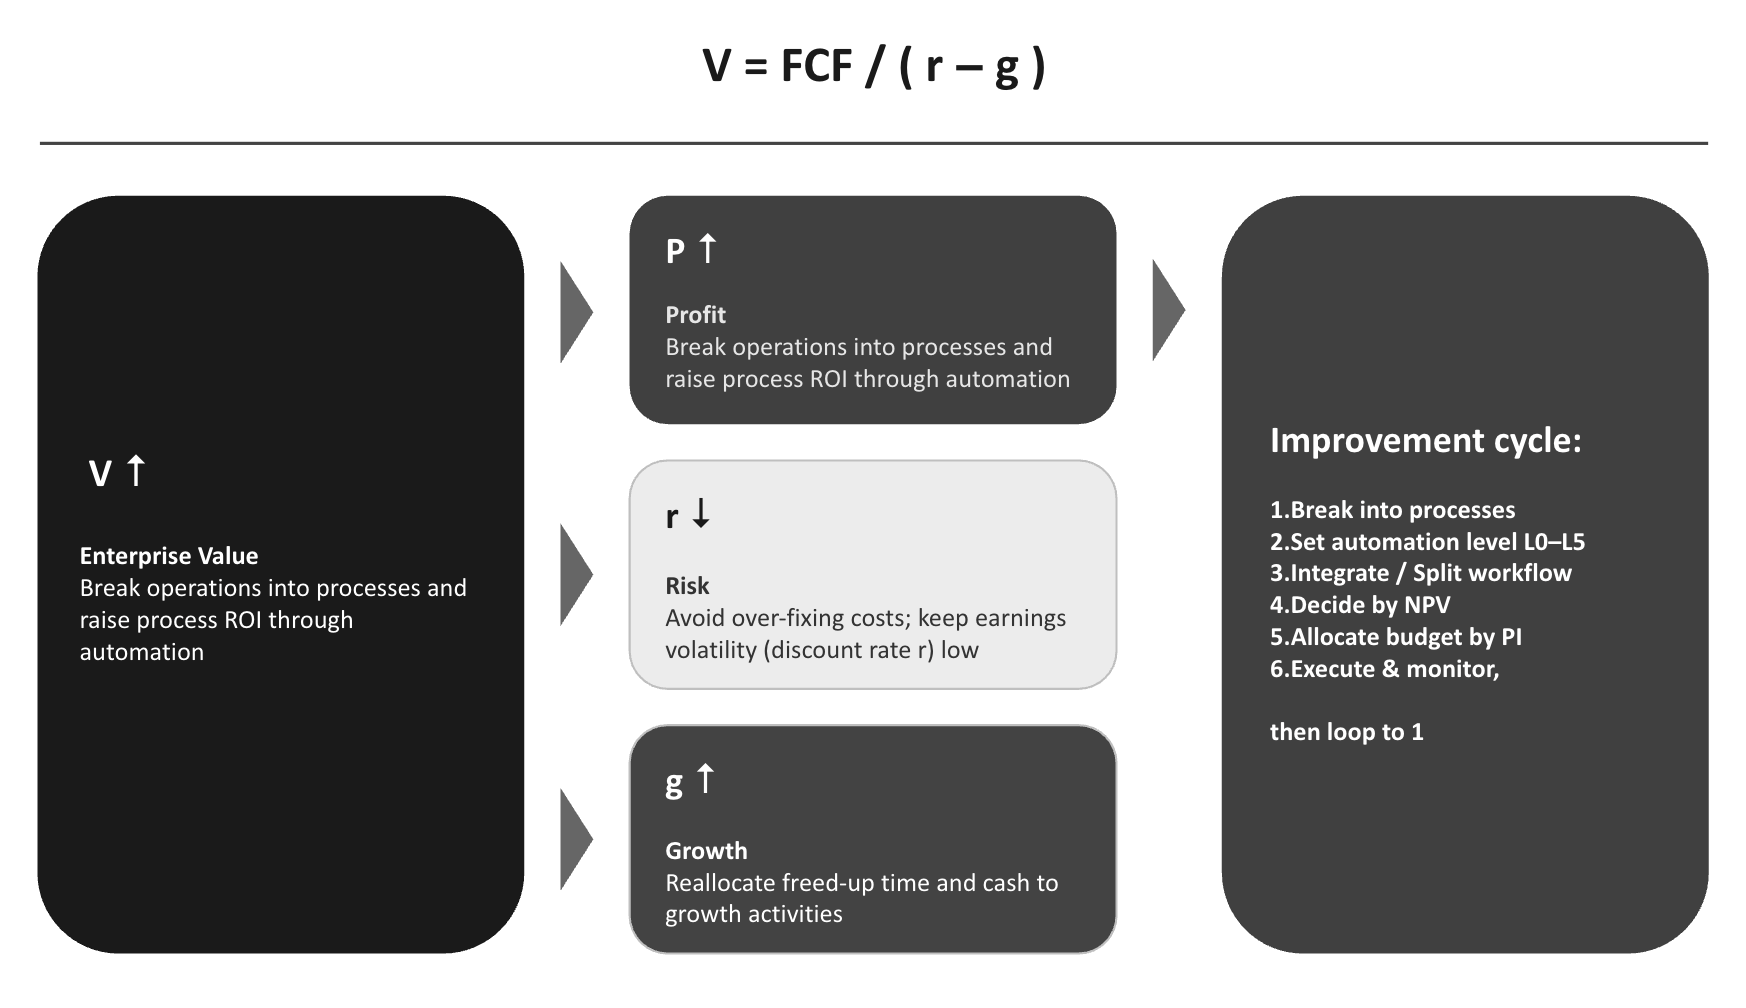
This formula is the lens through which this entire article views the problem. According to it, there are only three levers that move corporate value:
Increase profit () → Chapter 2: break operations down into processes and use automation to raise the profitability of each process
Contain risk () → Chapter 3: protect the cost structure, keep errors in check, and safeguard sustainability
Raise growth () → Chapter 4: redirect the freed-up resources toward growth
Corporate value then rises as you factor all three into the decision of where to invest (Chapter 5).
Actions for companies
Estimate, at the level of individual business processes, how much each initiative increases profit () (→ Chapter 2)
Note alongside this how each initiative changes risk (), and re-evaluate on a corporate-value basis any initiative that raises profit but also raises risk (→ Chapter 3)
Evaluate each initiative all the way through to how the resources it frees up feed into growth () (→ Chapter 4)
Case study (Company A, a hotel chain): profit went up, yet corporate value went down
Suppose Company A earns an annual profit of ¥1 billion, with、 . Its corporate value is then hundred million yen. Now suppose the company drastically cuts its front-desk and housekeeping staff to push profit up to ¥1.1 billion. Service quality falls, its reputation and occupancy rates become unstable, and rises to 10%. Corporate value becomes hundred million yen. Profit rose by ¥100 million, yet corporate value fell by roughly ¥4.3 billion. What matters is not simply increasing profit, but implementing measures that do not trigger an increase in risk.
2. Increasing Profit (): Process Decomposition and Automation
2.1 Break profit down to the level of individual processes
Company-wide profit can be broken down by business , and further by each business process (task) within that business, into "investment (Investment, ) × return (Return on Investment, ROI)." (Porter, 1985; Autor, 2015)
Automating and streamlining operations is an investment that raises the return on individual processes —the process-level ROI. Automation cannot be assessed at the level of the whole company or a business division. Only once you break things down to the process level can you see where labor and cost are tied up and where no value is being created. (Acemoglu & Restrepo, 2019; Brynjolfsson, Mitchell, & Rock, 2018)
Low-ROI processes can be identified in three steps.
(1) Measure costs: measure the actual cost of each process as "annual hours × hourly rate." (Kaplan & Cooper, 1998)
(2) Estimate value: approximations are fine. For processes directly tied to sales, estimate value from their relationship to revenue; for indirect processes, estimate it from "what would be lost if quality dropped" or by comparison with outsourcing prices.
(3) Shortlist the processes that combine "high cost × low contribution to value."
Actions for companies
Break each business down into processes (tasks) and make the cost and the value generated by each process visible
Identify processes with low ROI and put them on the candidate list for automation and efficiency improvement
Case study (Company B, a supermarket chain): which processes to target
Company B is considering which processes it should streamline through DX. It identifies low-ROI processes in the following three steps.
(1) Measure costs — count how much you pay for that work each year
All it takes is multiplication.
Customer service and shop-floor work: 30 person-hours per store per day (the combined time multiple staff spend serving customers, restocking, and arranging displays during opening hours) × 22 stores × 365 days ≈ 240,000 hours a year. At ¥1,500 per hour, mostly part-time staff: roughly ¥360 million a year
Ordering: 1 hour per store per day × 22 stores × 365 days ≈ 8,000 hours a year. At an hourly-equivalent rate of ¥3,000: ¥24 million a year
Flyers and price tags: 12,000 hours a year across head office and the stores × ¥3,000 = ¥36 million a year
Supplies ordering (copy paper, cleaning tools, etc.): 1 hour per store per month × 22 stores × 12 months ≈ 260 hours a year × ¥3,000 ≈ ¥800,000 a year
The key is to rephrase it as "we are paying ¥24 million for ordering." Hours alone don't convey the weight; once converted into money, the figures become comparable.
(2) Approximate value — roughly estimate how much that work is worth
Since value can't be measured precisely, use one of three approaches depending on the type of process.
Work directly tied to sales: for customer service, compare the purchase rate of customers a staff member approached with that of customers who weren't approached. A large gap means high value
Measure behind-the-scenes work by "what is lost if it's done badly": for ordering, sloppy ordering increases stockouts (lost sales) and waste (disposal losses). If that increase comes to ¥5 million a year, the value of the ordering process is "preventing ¥5 million in annual losses"
Compare with outsourcing prices: if flyer production costs ¥36 million a year in-house but could be done for ¥12 million through outsourcing or an automated generation tool, the ¥24 million difference is a sign that you're overpaying for it
(3) Two-axis screening — make "high cost × low value contribution" work the target of DX
Line up (1) and (2) and sort the processes into four quadrants by cost (large/small) and contribution to value (high/low).
Customer service and shop-floor work
Cost: very large (¥360 million)
Contribution to value: high (directly tied to sales)
DX priority: low (staff it more generously)
Flyer production
Cost: large (¥36 million)
Contribution to value: low (one-third the cost if outsourced)
DX priority: high (automation candidate)
Ordering
Cost: large (¥24 million)
Contribution to value: low (rule-based back-office work)
DX priority: high (automation candidate)
Supplies ordering
Cost: small (¥500,000)
Contribution to value: low
DX priority: defer (the payoff is small)
The only targets are those in the upper left: work that costs a lot but isn't where you differentiate. Work like customer service—high cost but also high value—is not an automation candidate.
That said, "ordering has low ROI" does not mean "ordering is unnecessary." Ordering is essential to running a store. The point is that necessary work is being done at an excessive price of ¥24 million a year, whereas automated ordering could deliver the same work for ¥4 million a year (system fees plus the labor cost of handling exceptions). Automation means keeping the value as it is and lowering only the price.
2.2 Decide the automation level: how much does profit change depending on how much you hand over?
The degree of automation is expressed on a six-level scale (Level, L) that generalizes the international standard for automated driving (SAE J3016). Similar frameworks are used to classify automation in a wide range of fields, including telecom network operations, surgical robots, maritime shipping, and BIM-based review. (SAE International, 2021; Parasuraman, Sheridan, & Wickens, 2000; Sheridan & Verplank, 1978)
L0 (manual): humans perform every step. No AI is used
L1 (assistance): AI supports by presenting information, doing preliminary research, and acting as a sounding board. Humans make the decisions and carry them out
L2 (partial automation): AI does the work, but humans check every case and give final approval
L3 (conditional automation): within defined conditions, AI handles everything from decision to execution; humans step in only for exceptions
L4 (high automation): within a limited domain, the work is completed with no human involvement at all
L5 (full automation): no humans are needed in any situation (for now an ideal, and almost entirely unrealized)
The change in annual profit from raising a given process to automation level (Level, : L0 manual through L5 fully automated), , can be written in three terms.
The terms on the right-hand side mean (labor cost saved) − (AI operating cost) − (expected loss from errors).
The symbols are as follows.
Hourly rate (wage, ) and annual hours (Hours, ): their product is the current labor cost
Human involvement ratio (human, ): at level , the share of time for which humans remain involved
AI operating cost (cost, )
Error rate (error, ), damage per error (Damage, ), and the detection rate—the share of errors that a human check catches—(detect, )
The key lies in the shape of . Up to L2 (AI does the work, humans check every case), stays high and labor costs barely fall. The moment you move up to L3 (humans look only at exceptions), drops all at once to the share of exceptions. In other words, the main battleground for impact is the single step of moving routine work from L2 to L3. (Endsley & Kaber, 1999; Parasuraman et al., 2000)
That said, levels have an upper bound . For processes where errors cannot be undone (irreversible), that involve human life, health, or large sums of money (large ), where the law requires the judgment of a licensed professional, or that involve interpersonal judgment, set the ceiling on the target level low. Accordingly, the resultingis expressed as follows.
In other words, set target automation levels according to the nature of the process:
"Routine × low-risk × reversible × high-volume" processes: target L3–L4. Humans check only exceptions, or merely monitor
"Semi-routine (a human is needed for the final decision)" processes: target L2. Humans check every case (AI produces the draft)
"Non-routine (weighty judgment, creativity)" processes: target L1. AI serves as a sounding board; humans make the decisions
"Irreversible, high-damage, or legally mandated" processes: target L2 or below. Humans check every case, and a licensed professional or responsible officer gives approval
"Interpersonal negotiation and physical work" processes: target L0–L1. Humans do the work, with AI limited to assisting with preparation and record-keeping (these are expected to gradually become automation targets through Physical AI) (Frohm, Lindström, Winroth, & Stahre, 2008)
Actions for companies
Check for processes stuck at L2—"we brought in AI, yet every single person is still there"
For routine, low-risk processes, set the goal of moving to L3, where humans handle only exceptions
Do not force up the level of processes that are irreversible, high-damage, or subject to legal requirements
Case study (Company C, an auto-parts plant): L2 versus L3 makes a threefold difference
Visual inspection of the parts Company C produces takes 10 inspectors and 20,000 hours a year (¥60 million in labor). Even after installing AI inspection cameras, at L2 (humans recheck every item,), the effect is M yen per year. If you raise it to L3 (where a person reviews only the 15% of cases in which the AI's confidence is low,), the result becomes M yen per year. With the very same AI, the payoff differs roughly threefold depending on whether you can stop having a person review every case. By contrast, we capped "final approval of shipment decisions" at L2, because it is an irreversible step: a defect that slips through leads directly to a market recall.
2.3 Redesigning the Workflow: Fit AI into the Existing Flow, or Rebuild It?
When setting the target level in Section 2.2, you face a choice between two options: transform the business flow, or leave it as it is.
Option A (leverage the existing flow): keep the current workflow—the way steps are divided and checks are sequenced—exactly as it is, and fit AI into each step
Option B (redesign the flow): take AI as the starting premise and rethink from scratch how steps are divided and where human checks are placed
Option A requires little investment and gets you started quickly, but it has a ceiling. The existing flow was built on the premise that "people do the work and people check it," so even when AI is introduced, the human checks stay in place and the involvement rate does not fall. What is more, the biggest drag on automation's payoff is not the steps themselves but the "seams" between them—the back-and-forth of handoffs, re-keying and re-checking that pass through human hands. If those seams remain manual, work stalls there, stays high, and the payoff plateaus at the L2 wall (the state in which people review every case). The payoff jumps when you take the step up to L3 (people look only at exceptions), but getting there requires rebuilding the flow itself. (Davenport & Short, 1990; Davenport, 1993)
Workflow redesign means redrawing the "boundaries of work" with AI as the premise. The movement runs in two directions that appear to be opposites. (Hammer, 1990; Hammer & Champy, 1993)
Integration (removing seams): bundle adjacent steps that used to be separate and run them end to end. Human handoffs disappear, making it easier for the flow as a whole to advance to L3
Decomposition (splitting a single step): divide one monolithic step into a routine portion that can be reduced to rules (run automatically) and a portion that requires judgment (handled by people), and automate only the routine portion
They look like opposites, but both are part of a single redesign of responsibility: deciding what to run automatically and where to keep human judgment and accountability. In practice this involves three tasks, which together form one continuous sequence.
Redraw the boundaries: integrate adjacent steps to eliminate seams, or decompose a single step into its routine and judgment portions
Reallocate by threshold: draw the line between "automatic up to here, human from here on" using thresholds (automation triggers) such as AI confidence, monetary amount and novelty
Reconfigure the controls: lighten the review method in stages as the track record accumulates—from reviewing every case, to sampling, to exceptions only, to monitoring only (while locking in the steps that must never be removed)
The choice between Option A and Option B likewise comes down to the size of the profit improvementeach delivers.
The effect of integration shows up mainly in the former (the reduction in ). Because Option B requires additional investment (process reconfiguration, training and data preparation), you choose Option B when the present value of the difference above exceeds that additional investment.
If the inequality runs the other way (the added payoff does not cover the added investment), stay with Option A. In practice, the safe path is to start small with Option A to confirm that the technology and the work are a good fit, and then invest in Option B step by step, beginning with the steps whose payoff has plateaued at the L2 wall—those where "AI was introduced, yet all the people are still there," i.e. where remains high. (Trigeorgis & Reuer, 2017)
Actions for companies
Start by automating on a small scale within the existing flow, and identify the steps whose payoff plateaus at the L2 wall
For those plateaued steps, redraw the boundaries of work by "integrating" adjacent steps or "decomposing" a single step
Design thresholds and controls (review method) to match the boundaries, and codify them as operating rules together with the automation level
Estimate flow redesign together with its additional investment, compare it against the additional payoff, and decide whether to adopt it
Estimate the damage amount for each step, and keep human checks where is large
Case study (Company D, a non-life insurer): combining integration and decomposition to break through the wall
Company D introduced AI into its claims handling. It began with Option A, fitting AI into each step of the existing flow—intake, recording, assessment and payment—with staff reviewing every case. But the handoff of documents between steps remained manual, and the payoff was marginal: a textbook L2 wall.
So the company rebuilt the flow under Option B. First came integration. The previously separate steps of "claim intake → recording → initial calculation of the insurance payout" were linked end to end, eliminating the handoffs (seams) between staff so that standard claims now flow automatically all the way through to the assessment calculation. Next came decomposition. "Payout assessment" was split into the mechanical calculation of the amount (reducible to rules) and the final decision on whether to pay (handled by people).
On that basis, thresholds and controls were designed according to the damage amount . For "claim intake and recording," an error can be corrected later by phone and is small, so review of every case was abolished (the extra loss from dropping the check is 100,000 cases × 1% × ¥2,000 = ¥2 million a year, against ¥25 million a year for full review—not worth it). Conversely, for the "final decision on whether to pay," an error hits customers' livelihoods and the company's credibility directly, and is large (the loss from dropping the check would be 20,000 cases × 1% × ¥1 million = ¥200 million a year, far exceeding the ¥30 million annual cost of full review), so review by an assessor was retained. Responsibility was redesigned by integrating away the seams while decomposing the judgment and leaving it with people.
2.4 Is It Worth the Investment? Deciding by NPV
The design work in Sections 2.2–2.3 determines the profit improvement . Whether to invest is decided by net present value (NPV): the lifetime payoff converted to today's value, minus the investment amount. (Brealey, Myers, & Allen, 2020)
If NPV is positive, the investment increases enterprise value. When comparing multiple projects, rank them by the profitability index (PI), the return earned per yen invested. Two caveats apply. First, the investment amount must include not just the cost of the system but also the cost of reconfiguring work, training and data preparation. Second, the payoff initially turns negative as learning costs come first, and only ramps up with a lag of one to two years (the so-called productivity J-curve). Do not declare a first-year loss a "failure"; decide whether to continue based on intermediate KPIs (data readiness rate, accuracy, automation rate). (Brynjolfsson, Rock, & Syverson, 2021)
Actions for companies
Judge individual projects by whether NPV is positive, and compare multiple projects by PI
Match the evaluation period of an investment to how long its effects last, not to the depreciation period
Do not pull out because of a first-year loss; decide whether to continue based on intermediate KPIs
Case study (Company E, a trucking company): the evaluation period changes the verdict
Company E is investing ¥120 million in AI-based dispatch planning (¥80 million for the system plus ¥40 million for data preparation and training). The payoff is −¥10 million in year 1 (learning comes first), +¥20 million in year 2, and +¥35 million a year from year 3 onward (). Cut off at five years, NPV is roughly −¥35 million; but the system will be in service for ten years, and evaluated over ten years NPV turns to roughly +¥60 million (PI = 0.5). How you treat the evaluation period and the early loss decides the outcome of the investment decision.
3. Containing Risk (): Stabilizing the Cost Structure
The second lever is the discount rate . It forms the denominator of , and the greater a company's earnings volatility (the ups and downs in its profits), the larger becomes. Therefore, when pursuing automation, you need to look not only at "how much profit it adds" but also at "how it changes earnings volatility, i.e. ." (Sharpe, 1964; Mandelker & Rhee, 1984)
The main channel through which automation moves is a change in the cost structure. When labor costs (a variable cost that can be cut as sales fall) are replaced with system costs (a fixed cost that cannot be cut even when sales fall), costs do not decline in a downturn, profits swing more widely, and rises. can be held down effectively by keeping costs as variable as possible. (Mandelker & Rhee, 1984)
Actions for companies
Give priority to contracts—usage-based pricing, leases and the like—that let costs fall in step with revenue
Before committing to large fixed investments, test their resilience under a downturn scenario (e.g. sales −20%)
When evaluating a measure, look not only at the size of the annual cost but also at the change in caused by converting costs into fixed costs
Case study (Company F, a SaaS company): choosing the cheaper option, yet enterprise value falls
To run AI-powered responses to customer inquiries, Company F compared two options for its computing resources.
Own-and-operate option: buy high-performance servers outright. Once purchased, the unit cost is low, but the cost is roughly fixed every year whether the servers are used or not (= fixed cost)
Usage-based option: pay an external AI service only for what is used. The unit cost is somewhat higher, but the cost falls when usage falls (= variable cost)
In a boom year with many inquiries, the own-and-operate option, with its lower unit cost, has the lower annual cost. Looking at that alone, it appears to be the right answer.
But when a downturn comes and inquiries fall by 30%, the difference emerges. Under the usage-based option, costs automatically fall 30% along with usage; under the own-and-operate option, the servers have already been bought, so costs barely fall. Sales drop but costs do not—in other words, profits swing more widely.
The wider a company's profit swings, the higher its discount rate climbs, enlarging the denominator of and lowering enterprise value. So even if the own-and-operate option is cheaper in annual cost under normal conditions, the usage-based option can come out ahead in enterprise value once downturn risk is factored in. "The lowest-cost option" and "the option that maximizes enterprise value" are not necessarily the same.
4. Raising Growth (): Redirecting Freed-Up Resources to Growth
The third lever is growth ( ). The sustainable growth rate is the product of the "share of profit reinvested (the reinvestment rate, )" and the "return earned on that reinvestment (return on invested capital, ROIC)." (Damodaran, 2012; Koller et al., 2020)
Automation raises through three channels.
First, improving the profitability of individual steps (Chapter 2) raises ROIC itself.
Second, if the freed-up staff hours and cash are redeployed to growth activities (product development, new markets, customer acquisition), rises.
Third, because an automated process incurs almost no additional cost as volume grows, it removes the bottleneck of "we can't grow because we don't have enough people."
As this expression makes clear, when it comes to enterprise value, a one-point improvement in carries exactly the same weight as a one-point decline in . Whether automation stops at "cost reduction" or becomes "fuel for growth" makes an enormous difference in how it affects enterprise value.
Actions for companies
Do not recoup the hours freed up by automation solely through headcount reductions; approve them together with a plan to redeploy people to growth-oriented work
For businesses with processes whose marginal cost has fallen, plan scale investments—such as expanding sales channels—at the same time
Manage the data accumulated in the course of automation as an asset that seeds the next round of improvements and new services
Case study (Company G, online learning service): same profit, 1.5× the value
Company I used AI-based grading and automated responses (L3: only difficult questions are escalated to instructors) to free up 60% of instructor time. Annual profit is ¥500 million, with . Previously, and ROIC = 10%, giving 、 hundred million yen.
If the freed-up time is redirected to developing new courses, so that and ROIC rises to 12%, the result is、 hundred million yen.
Even with current-period profit unchanged at ¥500 million, the improvement in growth alone raises enterprise value roughly 1.5×. If you measure automation only by the amount of cost saved, you miss this effect entirely.
5. Where to invest: optimizing budget allocation as a whole
The targets of automation investment are the processes identified through the breakdown in Section 2.1 (= business,= process). Once the NPV of each process—incorporating profit (Chapter 2), risk (Chapter 3), and growth (Chapter 4)—is in hand, the final question is how much of a limited budget (Budget, ) to allocate to which processes.
max{xij} Σ NPVij(xij) s.t. Σ xij ≤ B
Here, denotes the investment allocated to automating process (the decision variable: how much to invest). is the net present value that investment generates, and the constraint on the right represents the condition that "the total invested across all processes must not exceed the budget ."
In practice, it is enough to rank candidates by PI (NPV per yen invested) from highest to lowest and adopt them in that order until the budget is exhausted. The right decision is not to pour the entire budget into the single process that looks most lucrative, but to spread it across several processes in order of efficiency. (Brealey, Myers, & Allen, 2020; Kundisch & Meier, 2011)
Actions for companies
Rather than approving projects one at a time, line up all candidates by PI and adopt from the top until the budget runs out
Do not adopt projects with negative NPV on the grounds that they are trendy or that other companies have done them
Require approval requests to state four items—(1) profit improvement (including the period of initial losses), (2) the change in the discount rate r caused by converting costs into fixed costs, (3) error countermeasures for processes where damage would be severe, and (4) the investment amount—and make approval decisions within this framework
Case study (Company H, construction company / construction industry): how to allocate a ¥150 million budget
Company H's automation candidates (processes) and their evaluations can be summarized as follows.
Automating invoicing and payment processing (accounting): investment ¥20 million, NPV = ¥36 million, PI = 1.8 (generates ¥1.8 of value per ¥1 invested = the highest efficiency)
Drone surveying and as-built management (site): investment ¥120 million, NPV = ¥60 million, PI = 0.5 (the largest NPV in absolute terms, but less efficient than accounting)
Automated generation of daily work reports: investment ¥30 million, NPV = −¥3 million, PI = −0.1 (negative NPV = destroys enterprise value, so not adopted)
In PI order, allocate first to accounting (¥20 million), then to drone surveying (¥120 million), for a total of ¥140 million. Daily work reports are not adopted because their NPV is negative, even though budget remains. Had the company reasoned "we're a construction company, so start on site," it would have overlooked the most efficient project—accounting, which earns ¥1.8 for every ¥1.
6. Putting it into practice: steps for executives and practitioners
Here we bring everything covered so far together as the sequence to follow in practice. Run through the following steps for each process.
Make enterprise value the objective: evaluate initiatives not by profit alone but by their impact on all three of profit (), risk (), and growth () (Chapter 1)
Break the business down into processes: divide the business into processes (tasks), measure the actual cost of each and approximate its value, and shortlist "high cost × low value contribution" processes as automation candidates (2.1)
Set the target automation level: decide how far to raise each process along L0–L5, weighing both the benefit () and the ceiling (irreversibility, magnitude of damage, regulations, interpersonal nature). Aim for L3 in routine, low-risk processes (2.2)
Decide whether workflow transformation is needed: first pilot on a small scale within the existing workflow; for processes that plateau at L2, redraw the boundaries of work by "integrating" adjacent processes or "splitting" a single process. Decide by comparing the additional investment against the additional benefit (2.3)
Judge the investment by NPV: estimate not only the system cost but also the costs of restructuring, training, and data preparation, and decide adoption based on whether NPV is positive. Do not withdraw over a first-year loss; use interim KPIs to decide whether to continue (2.4)
Factor in risk and growth: check whether converting costs into fixed costs pushes up the discount rate , and whether the freed-up resources can be redirected to growth () (Chapters 3 and 4)
Allocate the budget in PI order: rank candidate processes by PI (NPV per yen invested) from highest to lowest and adopt until the budget is exhausted. Do not adopt negative-NPV projects (Chapter 5)
Execute, monitor, and iterate: measure post-implementation results (hours, error rates, damage amounts) and, in the next cycle, revisit the breakdown, levels, and boundaries (drawing on tools such as the IS Success Model). Return to step 1 (DeLone & McLean, 2016; Schryen, 2013)
This procedure is not a one-time exercise: with each cycle, your estimates of each value become more accurate, and the scope and precision of automation increase.
Conclusion
Under the theme of guidelines for automating corporate operations, we have organized—drawing on academic research and practitioner insight—how to plan and execute DX initiatives aimed at maximizing enterprise value. Whatever new technologies or social changes lie ahead, we hope this serves as a useful aid for improving corporate activities through a consistent process.
References
1. Acemoglu, D., & Restrepo, P. (2019). Automation and new tasks: How technology displaces and reinstates labor. Journal of Economic Perspectives, 33(2), 3–30.
Summary: A framework that views automation as the reallocation of tasks to capital, showing both the displacement effect and the reinstatement effect from new tasks.
2. Autor, D. H. (2015). Why are there still so many jobs? The history and future of workplace automation. Journal of Economic Perspectives, 29(3), 3–30.
Summary: A paper arguing that automation proceeds at the level of tasks rather than occupations, and that the value of complementary tasks rises.
3. Brealey, R. A., Myers, S. C., & Allen, F. (2020). Principles of corporate finance (13th ed.). McGraw-Hill Education.
Summary: A standard corporate-finance textbook covering NPV, the profitability index (PI), and investment selection under capital constraints.
4. Brynjolfsson, E., Mitchell, T., & Rock, D. (2018). What can machines learn, and what does it mean for occupations and the economy? AEA Papers and Proceedings, 108, 43–47.
Summary: Evaluates suitability for machine learning (SML) at the task level, showing that for most occupations only some tasks can be automated and job redesign is required.
5. Brynjolfsson, E., Rock, D., & Syverson, C. (2021). The productivity J-curve: How intangibles complement general purpose technologies. American Economic Journal: Macroeconomics, 13(1), 333–372.
Summary: Empirically shows that general-purpose technologies require complementary investment in intangible assets, producing an initial productivity dip followed by a later leap (the J-curve).
6. Damodaran, A. (2012). Investment valuation: Tools and techniques for determining the value of any asset (3rd ed.). Wiley.
Summary: A systematic treatment of DCF valuation and practical valuation methods, such as growth rate = reinvestment rate × ROIC.
7. Davenport, T. H. (1993). Process innovation: Reengineering work through information technology. Harvard Business School Press.
Summary: A foundational book on process innovation, presenting a methodology for reinventing business processes with IT as the premise.
8. Davenport, T. H., & Short, J. E. (1990). The new industrial engineering: Information technology and business process redesign. Sloan Management Review, 31(4), 11–27.
Summary: A pioneering paper arguing that IT and business process redesign are inherently one and the same, and presenting the process-redesign perspective.
9. DeLone, W. H., & McLean, E. R. (2016). Information systems success measurement. Foundations and Trends in Information Systems, 2(1), 1–116.
Summary: The D&M model, which measures information-system success along multiple dimensions—system, information and service quality, use, satisfaction, and net benefits.
10. Endsley, M. R., & Kaber, D. B. (1999). Level of automation effects on performance, situation awareness and workload in a dynamic control task. Ergonomics, 42(3), 462–492.
Summary: Human-factors research experimentally demonstrating how the level of automation affects performance, situation awareness, and workload.
11. Frohm, J., Lindström, V., Winroth, M., & Stahre, J. (2008). Levels of automation in manufacturing. Ergonomia – International Journal of Ergonomics and Human Factors, 30(3).
Summary: A framework that stages manufacturing automation by separating its physical and cognitive aspects (a perspective on automating physical tasks).
12. Gordon, M. J. (1959). Dividends, earnings, and stock prices. The Review of Economics and Statistics, 41(2), 99–105.
Summary: The classic paper that laid the foundations of the constant-growth (dividend discount) model.
13. Hammer, M. (1990). Reengineering work: Don’t automate, obliterate. Harvard Business Review, 68(4), 104–112.
Summary: The origin of BPR, arguing that processes should be rebuilt from scratch rather than existing work simply automated.
14. Hammer, M., & Champy, J. (1993). Reengineering the corporation: A manifesto for business revolution. HarperBusiness.
Summary: A management book systematizing the radical redesign of business processes (reengineering).
15. Kaplan, R. S., & Cooper, R. (1998). Cost & effect: Using integrated cost systems to drive profitability and performance. Harvard Business School Press.
Summary: A method that uses activity-based costing (ABC) to make costs and profitability visible at the level of individual processes and activities.
16. Koller, T., Goedhart, M., & Wessels, D. (2020). Valuation: Measuring and managing the value of companies (7th ed.). Wiley.
Summary: The standard practitioner reference (McKinsey) on DCF-based enterprise valuation and the drivers of value creation (ROIC and growth).
17. Kundisch, D., & Meier, C. (2011). IT/IS project portfolio selection in the presence of project interactions. Wirtschaftsinformatik Proceedings 2011.
Summary: A literature review on portfolio selection that accounts for interactions among IT projects.
18. Mandelker, G. N., & Rhee, S. G. (1984). The impact of the degrees of operating and financial leverage on systematic risk of common stock. Journal of Financial and Quantitative Analysis, 19(1), 45–57.
Summary: Empirically shows that operating leverage (fixed-cost ratio) and financial leverage raise a stock's systematic risk (β).
19. Parasuraman, R., Sheridan, T. B., & Wickens, C. D. (2000). A model for types and levels of human interaction with automation. IEEE Transactions on Systems, Man, and Cybernetics – Part A, 30(3), 286–297.
Summary: A framework that assigns automation levels to each of four functions: information acquisition, analysis, decision, and action.
20. Porter, M. E. (1985). Competitive advantage: Creating and sustaining superior performance. Free Press.
Summary: The classic work that introduced the value chain concept and established the perspective of decomposing value creation into individual activities.
21. SAE International. (2021). J3016: Taxonomy and definitions for terms related to driving automation systems for on-road motor vehicles.
Summary: The international standard defining L0–L5 for driving automation; the generalized model on which this guide's six automation levels are based.
22. Schryen, G. (2013). Revisiting IS business value research: What we already know, what we still need to know, and how we can get there. European Journal of Information Systems, 22(2), 139–169.
Summary: A synthesis of research on the value of IT investment, organizing evaluation issues such as intangible assets, lagged effects, and organizational capabilities.
23. Sharpe, W. F. (1964). Capital asset prices: A theory of market equilibrium under conditions of risk. The Journal of Finance, 19(3), 425–442.
Summary: The paper that presented the CAPM, showing the relationship between risk and expected return and laying the foundation for the link between discount rates and risk.
24. Sheridan, T. B., & Verplank, W. L. (1978). Human and computer control of undersea teleoperators. MIT Man-Machine Systems Laboratory.
Summary: The study that presented the prototype ten-level scale of automation, the origin of automation-level theories across all industries.
25. Trigeorgis, L., & Reuer, J. J. (2017). Real options theory in strategic management. Strategic Management Journal, 38(1), 42–63.
Summary: A review arguing that under uncertainty there is value in the flexibility (real options) to start small and then scale up or exit.
The end
Read next ↓