
Articles
How large a market should AI agent companies target? TAM theory, case studies, and latest research
Product
Career
Automatically translated from the Japanese original.
Introduction
In my day job, I build AI agents specialized for the real estate and construction sector. Whenever we create a new business or startup like this, we always estimate the TAM (Total Addressable Market) to analyze how large a market the new idea could actually reach. Run the numbers and the TAM typically comes out somewhere between several billion and tens of billions of dollars — but figures that large are hard to relate to, and it's easy to lose sight of what they really mean for the business you're about to build. Yet thinking about TAM is one of the most important things you can do, whether you're building a business or investing in one.
This article lays out how to calculate TAM properly, looks at TAM examples from well-known companies (top listed companies, general-purpose AI companies, AI agent companies and others), and reviews trends in the latest research.
Why TAM Matters
Defining TAM, SAM and SOM
Market size is usually described in terms of three concentric circles (Blank, S., & Dorf, B., 2012).
1. TAM (Total Addressable Market)
- Definition: The entire market — the total market size encompassing every potential target. It answers the question, "How much would this be worth if every target customer in the world bought?"
2. SAM (Served Available Market)
- Definition: The largest market you can reach through your own sales channels (the total size of the market within your reach). In other words, "the range you can sell into with your current products and distribution."
3. SOM (Serviceable Obtainable Market)
- Definition: Your immediate priority target — the market you can realistically capture given the competitive landscape and your own resources. It corresponds to "the revenue you can actually win within a few years."
Example: a smartphone app (a US-based AI Spanish conversation app priced at $10 a month): Applied to the case of developing and selling a smartphone app, the three tiers break down as follows.
- TAM: roughly 5 billion smartphone users worldwide × 20% with a latent need to learn a language (Spanish) × $120 in annual app spend = $120 billion
- SAM: roughly 300 million US smartphone users × 15% of adults who intend to learn a language (Spanish) × 20% of those with the habit or willingness to pay for learning apps × $120 in annual app spend = roughly $1.1 billion (about 1% of TAM)
- SOM (target market): net paying subscribers after three years (factoring in a monthly marketing budget of $175K, a customer acquisition cost (CAC) of $35 per paying user, 60,000 new paying users per year and a 3% monthly churn rate) × $120 = $14.4 million (about 1.3% of SAM)
Estimating these figures gives you a critical yardstick for judging whether a startup or new-business idea is worth the enormous effort and risk involved — or whether you should pivot.
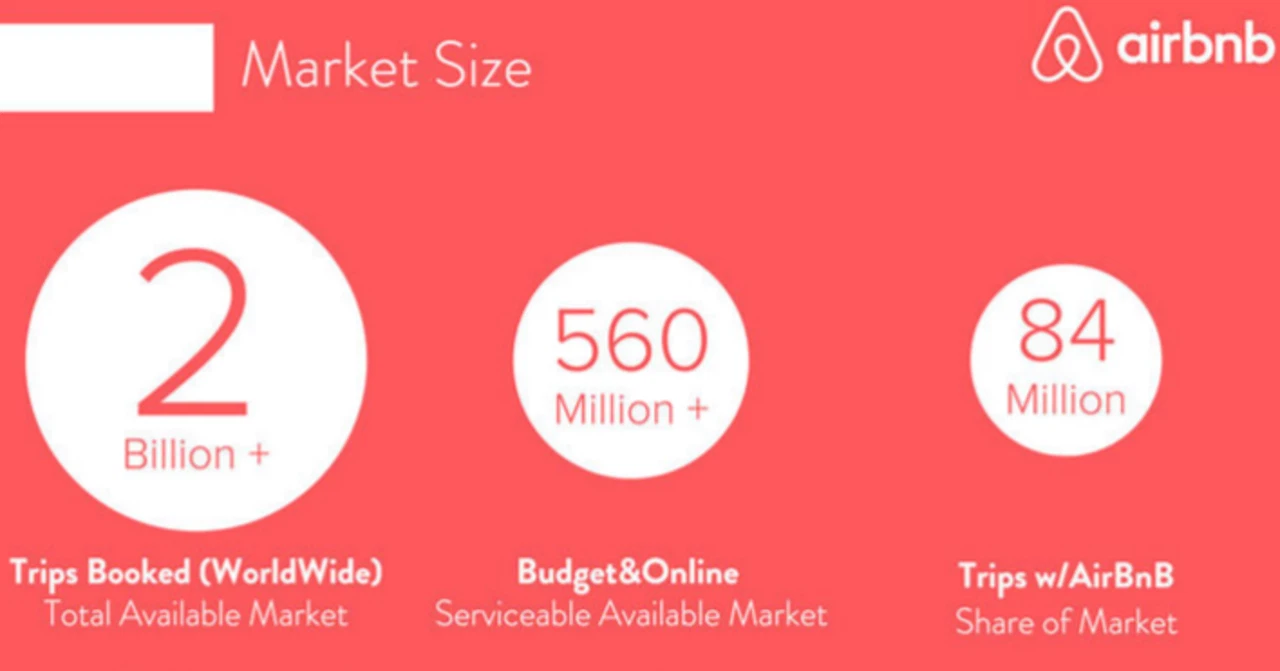
Take Airbnb. At its 2020 IPO, the company presented a TAM of $3.4 trillion (short-term stays $1.8 trillion + long-term stays $210 billion + experiences $1.4 trillion) and a SAM of $1.5 trillion (Airbnb, 2020). Its actual 2025 revenue was roughly $12.2 billion — less than 1% of SAM. That does not mean Airbnb failed. TAM is not a revenue forecast; it is the foundation for a discussion about where the ceiling of a business lies.
Why It Matters
There are three main reasons.
First, the structure of VC returns demands a large TAM. Both data and theory confirm that venture returns follow a power law — a few investments succeed spectacularly while the rest fail (Kerr, Nanda, & Rhodes-Kropf, 2014; Thiel & Masters, 2014). In Correlation Ventures' analysis of 21,640 investments, roughly 65% of deals lost money, and only 4% returned 10x or more (Levine, 2014). Horsley Bridge, an LP in top-tier funds, found in its analysis of 7,000 deals that just 6% of investments generated about 60% of total returns (Evans, 2016). Most of the portfolio fails, and a handful of massive hits produce the fund's entire return — and it is precisely this structure that leads VCs to require every individual investment to have "the scale to return the fund on its own" (Kupor, 2019). To an investor, a startup that will reliably return twice the invested capital is not investable, no matter how certain the outcome. That is why seed-stage investors treat TAM/SAM as the single most important indicator of scalability. Conversely, for businesses that do not depend on VC funding (new ventures inside large corporations, or self-funded companies), the bar for TAM can — and should — be far more flexible.
Second, TAM defines the "ceiling" of a business. No matter how brilliant your execution, you cannot generate more revenue than the market contains. Zoom, discussed below, presented a $43.1 billion market opportunity at its IPO (Zoom Video Communications, 2019), saw revenue surge during the pandemic, and then watched its growth rate decelerate sharply to the 4% range per year (Zoom Video Communications, 2026). Once a business hits the ceiling of its market, growth stops unless it finds its next TAM.
Third, how you define TAM is itself a strategy. In 2014, NYU professor Damodaran (2014), who defined Uber as "a business that captures a share of the global taxi market," valued the company at $5.9 billion. Gurley (2014), who defined it as "a business that expands the market itself as a substitute for private car ownership," countered that this estimate could be 25 times too low. A single choice of market definition changed the TAM by a factor of 25 — and with it, everything about product, pricing and go-to-market strategy. The real value lies not in the TAM figure itself, but in the thinking behind "how do we define our market?"
How to Calculate TAM, SAM and SOM
Sound Methods
In practice, the following approaches — and combinations of them — are the ones considered reliable.
The bottom-up method. This builds up "number of customers × price per customer" from actual customer segments and pricing models. Slack, for example, arrived at a $28 billion market opportunity in its S-1 by summing "number of companies × expected ARR" across tiers of company size (Slack Technologies, 2019). HubSpot likewise framed its opportunity in customer-count terms at IPO: "1.6 million mid-market companies in North America plus 1.3 million in Europe" (HubSpot, 2014). This is the method investors trust most. Because it connects directly to your own monetization model, the numbers carry accountability.
The value-theory (value-based) method. This works backward from the total amount customers currently spend to solve the problem (including the cost of alternatives and labor), estimating the value the product delivers and the share of that value that can be captured as price (Corporate Finance Institute, n.d.; Toptal, n.d.). For products that create a new market — where no research report on an existing category exists — this is often effectively the only option.
The framing used by the AI agent companies discussed below, in which "the TAM is the labor budget, not the software budget" — what Sequoia Capital calls "Service-as-a-Software," recasting the opportunity not as the software market (roughly $400 billion) but as the services and labor market (several trillion to $10 trillion) (Huang & Grady, 2024; Sequoia Capital, 2026) — is the modern incarnation of this value-theory method.
The top-down method (as a supplement). This starts from market-size reports published by research firms such as IDC and Gartner. It is useful for ensuring objectivity and as a cross-check on bottom-up estimates. Presenting TAM as a sum of IDC/Gartner segments, as Snowflake and Datadog did in their S-1s, is also standard practice at IPO (Snowflake, 2020; Datadog, 2019).
What matters is to present current TAM and future TAM separately. A strong business plan distinguishes between "the market that definitely exists today (estimated conservatively, bottom-up)" and "the market that opens up if behavior changes (with an explanation of the mechanism)."
Flawed Methods
The "1% of a giant market" argument "The global food market is $8 trillion. Capture 0.1% of it and that's $8 billion" — this calculation contains no information whatsoever about why you would capture 0.1%, or who would buy, at what price, through which channel. Guy Kawasaki, an early Apple evangelist and investor, calls this the "Chinese Soda Lie" and counts it among the standard lies entrepreneurs tell in pitches: founders say "if just 1% of people in China drink it...", but capturing that 1% is precisely the hard part, and a company that only aims for 1% is not an interesting investment in the first place (Kawasaki, 2015). Investors dislike this argument because it signals that the thinking has stopped.
Mistaking an adjacent giant market for your TAM Beyond Meat went public with "the $1.4 trillion global meat market" as its opening line (Beyond Meat, 2019), but the company's actual TAM was "spending by consumers willing to switch to plant-based meat" — a very different thing from the meat market. Even at the time of the IPO, observers pointed out that the company's market should be measured not at $1.5 trillion but at the roughly $5 billion of the plant-based meat category (Valuentum Securities, n.d.). Sure enough, revenue peaked at roughly $460 million in 2021 and fell to $276 million by 2025 (Beyond Meat, 2026). The giant market next door is not your TAM.
Confusing stock with flow The framing frequently used in Mercari's early days — "Japanese households are sitting on trillions of yen worth of unused items (hidden assets)" (みんなのかくれ資産調査委員会, 2018) — describes the total volume of assets (a stock), not annual transaction value (a flow). The actual flea-market app market (annual gross merchandise value), according to a survey by Japan's Ministry of Economy, Trade and Industry, is a few dozen times smaller (経済産業省, 2024). Confusing stock with flow, or total spending with capturable revenue, is a common mistake.
Presenting top-down figures alone The problem is not pasting in a number from a research report per se; it is failing to connect that number to your own customer definition and pricing. A report's market definition almost never matches the scope of your business. Aulet, who leads MIT's entrepreneurship education program, makes it a principle of market sizing to build estimates bottom-up from concrete end-user profiles rather than cite research reports (Aulet, 2013).
How Big a TAM Should You Aim For?
Founders seeking venture capital in the US will encounter a fairly widely shared rule of thumb: a business with a TAM below $1 billion (roughly ¥150 billion) is unlikely to be considered venture-scale, and from Series A onward, presenting a TAM in the tens to hundreds of billions of dollars is effectively the standard. This follows directly from fund arithmetic. If a fund's model assumes that a single portfolio company must be capable of "returning the fund," then that company needs room to reach hundreds of billions of yen in revenue—which in turn requires a market of at least several hundred billion to several trillion yen.
That said, this rule of thumb comes with three important caveats.
First, the initial market can be small—in fact, smaller is better. When Amazon went public in 1997, its entry point was the US book market, worth $26 billion—a niche by the standards of retail as a whole (Amazon.com, 1997). Its revenue today is $716.9 billion, roughly nine times the size of the global book market it cited at the time ($82 billion). As Peter Thiel's advice to "monopolize a small market" suggests, the right way to think is in pairs: a small market you can win (the wedge) and the large market it connects to (the TAM expansion path).
Second, TAM is not static. When ServiceNow went public in 2012, its core market—IT service management—was estimated at only about $1.5 billion, and a short-selling fund attacked the company on the grounds that "the market is too small" (Kerrisdale Capital, 2012). Its revenue today is roughly $13.3 billion—about nine times what was then considered the "entire market." The product expanded the market. The reverse also happens: a large TAM figure is no guarantee that the market will respond (we take this up in Chapter 6).
Third, if you aren't raising venture capital, the benchmarks change. For a new venture inside a large corporation, the question becomes whether the market offers a credible path to ¥10 billion in revenue within three to five years; for a bootstrapped company, whether the market—niche or not—can be defended with high margins. The "right" size for a TAM is subordinate to your capital strategy and exit design.
The TAMs and Actual Revenues of 30 Well-Known Companies
Below, we compare the TAM stated in each company's IPO prospectus (S-1 or equivalent), its most recent revenue, and the share of that stated TAM the company has actually captured (%).
Case studies
We compare the TAM declared in each company's IPO prospectus (S-1 or equivalent) or similar documents, its most recent revenue, and the percentage of the declared TAM that recent revenue represents ("attainment"). Where a company did not publish a monetary TAM, we use reference figures (marked ※) reconstructed from market data of the time. Treat attainment as a rough guide only.
- Uber (ride-hailing) — TAM: $5.7T, personal mobility market (2019 S-1) / Latest revenue: $52.0B (2025) / Attainment: 0.9%. Measured against the "$4.2B US taxi market" in its 2008 seed deck, however, attainment is 1,238% (roughly 12x). The canonical example of a company that expanded its market rather than simply hitting it.
- ServiceNow (IT service management cloud) — TAM: $1.5B, ITSM market (2012) / Latest revenue: $13.3B (2025) / Attainment: 887%. Grew to roughly nine times the market that short-sellers called "too small."
- Amazon (e-commerce and cloud) — TAM: $82B, global book market (1997) / Latest revenue: $716.9B (2025) / Attainment: 874%. From a wedge in books to "the everything store" and AWS.
- Salesforce (CRM cloud) — TAM: $7.1B, CRM market (2004) / Latest revenue: $41.5B (fiscal year ending January 2026) / Attainment: 585%. Roughly six times the entire CRM market of the time.
- Netflix (video streaming) — TAM: $21B, US home video market (2002) / Latest revenue: $45.2B (2025) / Attainment: 215%. Displaced the old market and created a new one: streaming.
- Spotify (music streaming) — TAM: approx. $17B, global recorded music market (2017)※ / Latest revenue: €17.0B (2025) / Attainment: approx. 110%. A single company now exceeds the size of the entire music industry at the time of its IPO.
- Workday (HR and finance cloud) — TAM: $39B, ERM market (2012) / Latest revenue: $9.6B (fiscal year ending January 2026) / Attainment: 25%.
- Shopify (e-commerce platform) — TAM: approx. $46B, global SMB commerce (2015)※ / Latest revenue: $11.6B (2025) / Attainment: approx. 25%. Continues to redefine its TAM to encompass the enterprise segment.
- Canva (online design tool) — TAM: approx. $15B, design software market (at founding)※ / Latest revenue: $3.5B annualized (2025, private company, per press reports) / Attainment: approx. 23%. From amateur users into Adobe's territory.
- CrowdStrike (cybersecurity) — TAM: $24.6B (2019) / Latest revenue: $4.8B (fiscal year ending January 2026) / Attainment: 20%. Has repeatedly revised its TAM upward.
- Atlassian (developer collaboration tools) — TAM: $35B (2015) / Latest revenue: $5.2B (fiscal year ending June 2025) / Attainment: 15%. Steady, compounding growth.
- Zoom (video conferencing) — TAM: $43.1B, UC&C (video communications) market (2019) / Latest revenue: $4.9B (fiscal year ending January 2026) / Attainment: 11%. After a pandemic-era surge, growth has plateaued in the 4% range.
- Twilio (communications APIs) — TAM: $45.4B (2016) / Latest revenue: $5.1B (2025) / Attainment: 11%. Has grown almost exactly as its framing suggested.
- Toast (restaurant POS and operations software) — TAM: $55B, projected restaurant tech spending (2021) / Latest revenue: $6.2B (2025) / Attainment: 11%. Steadily expanding its share within the market.
- Sea (Southeast Asian e-commerce, gaming, and fintech) — TAM: approx. $200B, projected Southeast Asian digital economy (2017)※ / Latest revenue: $22.9B (2025) / Attainment: approx. 11%. Expanding in step with the market itself.
- Datadog (system monitoring) — TAM: $35B (2019) / Latest revenue: $3.4B (2025) / Attainment: 10%. Still growing at +28%.
- Coupang (Korean e-commerce) — TAM: $470B, Korean retail, dining, and travel spending (2021) / Latest revenue: $34.5B (2025) / Attainment: 7.3%. Extending its single-country framing to Taiwan and beyond.
- Snowflake (cloud data platform) — TAM: $81B (2020) / Latest revenue: $4.5B (fiscal year ending January 2026) / Attainment: 6%. Its TAM, too, keeps growing through recalculation.
- Dropbox (cloud storage) — TAM: $50B (2018) / Latest revenue: $2.5B (2025) / Attainment: 5%. Growth stalled at this level and revenue has begun to decline.
- Tesla (electric vehicles) — TAM: approx. $2T, global automotive market (2010)※ / Latest revenue: $94.8B (2025) / Attainment: approx. 4.7%. Grew to roughly 1,000 times the size of its original premium-EV niche, but posted its first revenue decline in 2025.
- DoorDash (food delivery) — TAM: $302.6B, US restaurant takeout spending (2020) / Latest revenue: $13.7B (2025) / Attainment: 4.5%. Expanding its framing into grocery, retail, and international markets.
- HubSpot (marketing and sales cloud) — TAM: approx. $76B (company figure published in later years)※ / Latest revenue: $3.1B (2025) / Attainment: approx. 4%. At IPO, it framed the market by company count: "2.9 million mid-sized businesses."
- Palantir (data analytics platform) — TAM: $119B (2020) / Latest revenue: $4.5B (2025) / Attainment: 3.8%. Accelerating, with +56% growth.
- Figma (design collaboration tool) — TAM: $33B (2025) / Latest revenue: $1.1B (2025) / Attainment: 3.2%. Growing at +41% fresh off its IPO.
- Peloton (connected home fitness bikes and streaming) — TAM: approx. $100B, global fitness market (2019)※ / Latest revenue: $2.5B (fiscal year ending June 2025, fourth consecutive year of declining revenue) / Attainment: approx. 2.5%. At IPO it framed the market by household count—"67 million US households"—and overestimated demand.
- Mercari (marketplace app) — TAM: ¥7.6 trillion, the "hidden assets" sitting in Japanese households (2018)※ / Latest revenue: ¥192.6 billion (fiscal year ending June 2025) / Attainment: 2.5%. Mature in its home market, with growth down to single digits.
- Airbnb (short-term rentals and lodging bookings) — TAM: $3.4T, lodging plus experiences spending (2020) / Latest revenue: $12.2B (2025) / Attainment: 0.4%. Less than 1% of TAM even after years of high growth—a good illustration that TAM is a framing, not a forecast.
- Instacart (grocery delivery) — TAM: $1.1T, US grocery retail (2023) / Latest revenue: $3.7B (2025) / Attainment: 0.3%. Despite an enormous TAM, growth is stuck at +11%.
- Stripe (online payments) — TAM: approx. $6T, global e-commerce market (2024)※ / Latest revenue: estimated at over $5B (2024, per press reports) / Attainment: approx. 0.1%. Its official framing is "the GDP of the internet"—a denominator that is itself expanding.
- Beyond Meat (plant-based meat alternatives) — TAM: $1.4T, global meat market (2019) / Latest revenue: $0.28B (2025) / Attainment: 0.02%. The vast adjacent market turned out not to be its TAM.
- Robinhood (stock trading app) — TAM: $50T, US household financial assets (2021) / Latest revenue: $4.5B (2025) / Attainment: 0.009%※ (reference only, since this compares revenue against a stock of assets). Re-accelerating through crypto and other lines after a slump.
※ Indicates a reference figure that the author reconstructed from market data of the time, because the company did not publish a monetary TAM (or used a basis—such as assets, market capitalization, or company counts—that cannot be compared directly with revenue).
Patterns
Three patterns emerge from this table.
Pattern 1: The winners didn't "hit" their TAM—they expanded it. The latest revenues of Amazon, Salesforce, ServiceNow, Netflix, and Uber are each several times the size of the market they cited at IPO or founding—attainment of 200–1,200%. Judged purely on the accuracy of their initial TAM, every one of them "missed." Upward. What they have in common is that their products changed how customers behave and thereby expanded the total size of the market itself. In 2014, NYU professor Aswath Damodaran valued Uber at $5.9 billion, using "a $100 billion global taxi market × 10% share" (Damodaran, 2014). Benchmark's Bill Gurley countered that "Uber isn't taking share of an existing market; as a substitute for car ownership it will expand the market severalfold, and the estimate may be off by a factor of 25" (Gurley, 2014). Gurley won decisively: Uber's most recent gross bookings reached $193 billion (Uber Technologies, 2026).
Pattern 2: TAM ceilings are real. Zoom's growth rate fell to single digits at roughly 11% of its declared TAM ($43.1 billion). Dropbox pointed to a market of more than $50 billion, but plateaued at $2.5 billion in revenue (5% attainment) and has since slipped into decline. Mercari, too, saw growth drop to single digits as Japan's marketplace-app market matured. Because markets are finite, at some point a company must expand into its "next TAM" (Zoom into telephony and contact centers; Mercari into fintech and the US), and when that expansion fails, growth stops. What is striking is that the companies that decelerated cluster in the 10–25% attainment zone. In practice, capturing 20–30% of your TAM may be where the ceiling begins.
Pattern 3: A huge TAM does not guarantee growth Instacart (0.3% TAM penetration) grew only 11%, while Peloton and Beyond Meat (0.02% penetration) continue to see revenue decline. Low penetration does not automatically mean ample headroom. The size of a TAM and the speed and durability with which customers actually switch to a product turn out to be entirely separate variables.
TAM for AI Agent Companies
Nowhere is the TAM debate sharper today than in AI. The key lies in a redefinition of TAM: AI captures not software spend but labor (payroll) spend. The global cloud software market is roughly $400 billion, whereas the market for services and labor runs into the tens of trillions of dollars. Sequoia Capital dubbed this "Service-as-a-Software" and framed it as a $10 trillion-class opportunity. In a March 2026 essay, it argued that "the next trillion-dollar company won't sell software; it will sell the work itself," citing a ratio of six dollars spent on services for every dollar spent on software (Sequoia Capital, 2026). Foundation Capital (n.d.) likewise put forward an estimate of $4.6 trillion, combining payroll for sales, engineering, HR and other functions with BPO spend.
General-Purpose AI Companies
- OpenAI — TAM framing: "replacing and augmenting global knowledge work" (worldwide knowledge-worker payroll of roughly $25T*) / Annualized revenue: $25 billion by mid-2026 / TAM penetration: roughly 0.1% / Valuation: $852 billion (at its March 2026 fundraising) (OpenAI, 2026). The company is reportedly targeting $280 billion in revenue by 2030, while also expected to burn some $27 billion in cash in 2026 alone—a case of the largest TAM ever defined, "humanity's labor market," being used to justify the largest upfront investment in history.
- Anthropic — TAM framing: enterprise knowledge work (as above, roughly $25T*) / Annualized revenue: $30 billion as of April 2026 / TAM penetration: roughly 0.1% / Valuation: $965 billion, with a confidential IPO filing reported in June 2026 (Fortune, 2026). CEO Dario Amodei has framed the TAM in labor-market terms, warning that "half of entry-level white-collar jobs could disappear within five years," yet in 2026 he also invoked an expansion framing rather than a substitution one: "automate 90% and the remaining 10% of humans become ten times more productive" (the Jevons paradox).
- Google (Gemini) — TAM framing: integrating AI into its existing cloud business (global cloud market of roughly $700B*) / Related revenue: cloud business at an annualized $70 billion-plus, growing 60% (Alphabet, 2026) / TAM penetration: roughly 10% (relative to the cloud market). This is a strategy of harvesting TAM not as a separate line of business but as the growth rate of an existing one.
Industry-Specific AI Agents
- Harvey (legal) — TAM framing: the $1T legal services market (versus only $40B in traditional legal software spend) / Latest ARR: $190M (January 2026) / TAM penetration: 0.02% / Valuation: $11B (March 2026)
- Cursor / Anysphere (software development) — TAM framing: $1.5T-plus in software engineer payroll / Latest ARR: $2B (February 2026) / TAM penetration: 0.13% / Valuation: $29.3B, and reportedly in talks to raise at $50B
- Cognition / Devin (software development) — TAM framing: "replacing software teams" (as above, $1.5T*) / Latest ARR: roughly $492M (May 2026) / TAM penetration: roughly 0.03% / Valuation: $26B (May 2026)
- Sierra (customer service) — TAM framing: $400B per year in customer service spend / Latest ARR: $150M+ (mid-2026) / TAM penetration: 0.04% / Valuation: $15.8B (May 2026)
- Glean (enterprise search) — TAM framing: enterprise knowledge work at large / Latest ARR: $300M (May 2026) / TAM penetration: — (no dollar TAM disclosed) / Valuation: $7.2B (June 2025)
- OpenEvidence (healthcare) — TAM framing: $20–25B in pharmaceutical advertising aimed at physicians / Latest revenue: $100M+ (January 2026) / TAM penetration: roughly 0.4–0.5% / Valuation: $12B (January 2026)
- Decagon (customer support) — TAM framing: replacing support payroll (as above, $400B*) / Latest ARR: roughly $35M (estimated) / TAM penetration: roughly 0.009% / Valuation: $4.5B (January 2026)
* Figures marked with an asterisk are reference values the author has filled in from data on adjacent markets or labor spend, because the company has not published a dollar TAM.
One thing stands out from these calculations. Even Cursor, with the highest penetration, sits at 0.13%, and most are below 0.1%—meaning that if you take the labor-TAM thesis at face value, AI agent companies are still standing at the very threshold of their markets. These figures can be read either as "enormous room to grow" or as "the TAM framing is still only a hypothesis," and they quantitatively reinforce the argument in Chapter 5 of the main text that valuations are front-running TAM. If this is incorporated into the main text, we recommend placing this sentence immediately after the bulleted list.
Trends
Three points deserve attention here.
First, Harvey's contrast between "$1 trillion in legal services vs. $40 billion in legal software" is the most succinct illustration of how vertical AI redefines TAM (CNBC, 2026b). Traditional legal tech fought over the software budget ($40 billion); AI agents can price against lawyers' working hours themselves ($1 trillion). Sierra's outcome-based pricing—charging per resolution—springs from the same philosophy.
Second, growth rates are beginning to bear out the TAM thesis. Cursor went from $100 million to $2 billion in ARR in 12 months, and Harvey from $100 million to $190 million in five months—several times the pace of the best companies of the SaaS era (TechCrunch, 2026).
Third, however, valuations are front-running TAM. Decagon is valued at $4.5 billion against roughly $35 million in ARR (about 130x), a level that cannot be explained without the labor-TAM thesis (Bloomberg, 2026)—and one that simultaneously exposes the risk of a correction should that hypothesis prove wrong. David Haber of a16z's remark that "in vertical AI, market structure is the new TAM" suggests that what matters more than headline market size is the industry's purchasing structure, its regulation, and where its data resides.
Failures and Their Causes
Case Studies
The companies that have exited the stage teach us that market size is not even a necessary condition for success.
- WeWork (coworking space) — Market claimed: the vast real estate market, under the banner of "space as a service" / Capital raised & valuation: roughly $12.8B raised, peak valuation of $47B / Outcome: filed for Chapter 11 bankruptcy in the US in 2023; more than 90% of its valuation wiped out
- Quibi (mobile video streaming) — Market claimed: short-form mobile video as a new category / Capital raised: $1.75B before launch / Outcome: liquidated in 2020, just six months after launch. The demand simply never existed
- Katerra (construction tech) — Market claimed: the global construction market (~$12T) / Capital raised: roughly $2B (led by SoftBank) / Outcome: bankrupt in 2021; it could not change the industry's subcontracting structure
- Convoy (truck freight matching) — Market claimed: US trucking, $800B / Capital raised & valuation: roughly $1B raised, peak valuation of $3.8B / Outcome: abruptly shut down in 2023; its technology was sold to Flexport for roughly 2% of the capital it had raised
- Olive AI (healthcare administration automation) — Market claimed: automating US healthcare administrative costs / Capital raised & valuation: roughly $850M raised, peak valuation of $4B / Outcome: dissolved and sold off in pieces in 2023; reported to have been manual work dressed up as AI
- Theranos (blood testing) — Market claimed: the US clinical laboratory testing market (~$75B) / Capital raised & valuation: $700M+ raised, peak valuation of $9B / Outcome: the technology never worked, and the founder was imprisoned for fraud
- MoviePass (unlimited movie subscription) — Market claimed: the $11B US box office plus an audience-data business / Capital raised: roughly $200M burned / Outcome: service shut down in 2019 and the parent company went bankrupt. The more it was used, the more money it lost
- Babylon Health (AI telehealth) — Market claimed: global telemedicine / Valuation: $4.2B at its SPAC listing / Outcome: bankrupt and sold off in 2023; losses ballooned with every additional patient
Causes of Failure
The causes of failure are strikingly consistent.
Cause 1: TAM is not demand. In CB Insights' well-known analysis of 483 startup post-mortems, the single biggest cause of death was "no market need" (42%), ahead of "ran out of cash" (29%) (CB Insights, 2021). Quibi had $1.75 billion in funding and a first-rate management team, but there was simply no demand for its product—paid, mobile-only short-form drama—and, competing against free TikTok and YouTube, it was liquidated six months after launch (NBC News, 2020). A market-sizing slide does not generate a single dollar of demand.
Cause 2: Scale does not cure broken unit economics. MoviePass sold "unlimited movies" for $9.95 a month while buying tickets at close to full price. Members watched 2.11 films a month, far above the break-even point of 0.77 films, so the more the service was used, the deeper the losses grew. It attracted 3 million members with that structure intact and collapsed while burning more than $20 million a month (its executives were later convicted of securities fraud) (Yahoo Finance, 2022). Babylon Health, likewise, was paid by the NHS for two to three consultations per patient per year while patients actually used the service six to seven times—a "more patients, more losses" structure that the CEO himself acknowledged (Hospitalogy, 2023; TechCrunch, 2023). However large the TAM, if the economics of each transaction are negative, growth only hastens death.
Cause 3: Importing "tech-company multiples" into low-margin industries. WeWork (real estate), Katerra (construction) and Convoy (freight) each set out to "reinvent with technology" an industry that was enormous but structurally low-margin. WeWork, saddled with the duration mismatch between 15-year leases and month-to-month memberships, filed for Chapter 11 bankruptcy in the US in 2023 (WeWork, 2023). Katerra was defeated by clients who refused to abandon the traditional subcontracting structure—Axios summed it up as "a failure of (tech-company) pattern matching" (Axios, 2021). Convoy shut down abruptly, undone by brokerage margins that technology could not improve and a deteriorating freight-rate market (Fortune, 2023). The size of a TAM tells you nothing about how hard that market is to capture.
Cause 4: The technology never catches up with the TAM narrative. Theranos's blood-testing technology never worked as claimed, yet the story of a giant market continued to sustain $900 million in funding and a $9 billion valuation (Carreyrou, 2018). Olive AI billed itself as "AI," but an Axios investigation found that much of what it actually did was routine-task automation involving manual work; the company dissolved in 2023 (Axios, 2023). Hyperloop One ceased operations in 2023 with a top speed in crewed tests of 172 km/h—less than 15% of what it had promised (Bloomberg, 2023). In today's AI boom, this is probably the failure pattern most likely to be replayed.
Cause 5: Abundant capital masks the absence of product-market fit. Of the companies above, Katerra, Convoy, Better.com and Zume Pizza all received large investments from SoftBank-affiliated funds (Axios, 2021, 2023). As the inside account of WeWork made clear, vast capital reinforces the founder's conviction in the narrative and delays by years the "rejection signals" from the market that would otherwise have surfaced early (Brown & Farrell, 2021).
Recent research on TAM
There is little peer-reviewed academic research on TAM itself, but a body of findings has accumulated in related fields. Four strands stand out.
(1) How entrepreneurs misjudge markets—the overconfidence literature. The classic is the experimental study by Camerer and Lovallo (1999), which showed that in markets where payoffs depend on relative skill, entry becomes excessive and industry-wide profits turn negative. The key mechanism is "reference group neglect"—the cognitive habit of failing to account for the fact that competitors just as confident as you are entering at the same time. Applied to TAM estimation, the danger of the "1% of the market" argument is that a hundred other companies intend to take the same 1%. More recently, Feiler and Tong (2022) showed, both theoretically and experimentally, that when noisy demand signals are used directly as forecasts, the opportunities that look largest are systematically overestimated. The very act of picking "the one with the biggest TAM" from a set of market opportunities has optimism bias statistically built into it. Cassar (2010), meanwhile, found that entrepreneurs who prepared formal financial projections were in fact more optimistically biased in their forecasts, suggesting that a detailed spreadsheet can reinforce the "inside view." On the other hand, a critical review by Chwolka and Raith (2023) argues that overconfidence's effect on entry can be either positive or negative, pushing back against the simple narrative that "entrepreneurs are overconfident."
(2) How to forecast a market that does not yet exist—diffusion models and the outside view. The classic tool for forecasting demand in a new market is the Bass (1969) diffusion model, which draws an adoption curve from an innovation coefficient and an imitation coefficient. More recent work has moved toward "extrapolating from comparable cases," for example by using machine learning to estimate Bass parameters before launch from data on similar product groups (Lee et al., 2014). This is the same philosophy as reference class forecasting, Flyvbjerg's (2006) institutionalization of Kahneman and Tversky's "outside view." In megaproject research, forecasts based on the inside view produce median (cost) overruns of 50–100%, whereas forecasts drawn from the distribution of comparable projects land within 10–20% of P50 (the median). The implication for TAM estimation is clear: do not rely solely on your own bottom-up calculation; always consult the distribution of "how much revenue businesses that previously launched in the same category had reached by year five." A review organizing the methodological challenges of this approach appeared as recently as 2025 (Production Planning & Control), so the research is still very much in progress.
(3) Do investors look at the market or the team? In a large-scale survey of 885 institutional venture capitalists by Gompers et al. (2020), VCs reported that they weight the "team" more heavily than the market or the technology, both when selecting deals and when attributing success. A randomized experiment on AngelList (Bernstein et al., 2017) likewise found that angel investors respond to information about the founding team, not to traction or market information. And yet, when Kaplan et al. (2009) tracked VC-backed companies from business plan to IPO, they found that the business (i.e., the market) was remarkably stable while management changed frequently (CEO retention was 44%), concluding that "at the margin, bet on the horse (the business and market), not the jockey (the team)." There is a tension between what investors say (team first) and the structure the data reveals (markets are hard to change; people can be replaced)—evidence that, from the other direction, supports the importance of scrutinizing TAM.
(4) How to test market hypotheses—the "entrepreneur as scientist." In an RCT of 116 Italian companies by Camuffo et al. (2020), entrepreneurs trained to formulate explicit market hypotheses and test them scientifically generated higher revenue than the control group, shut down failing businesses sooner, and pivoted more accurately. The results were replicated in a large-scale follow-up spanning 759 companies and four RCTs (Camuffo et al., 2024). Read in a TAM context, the lesson is this: TAM is not "a number you calculate and are done with" but "a hypothesis to be tested." A market-size estimate becomes useful for decision-making only once it has been decomposed into its constituent assumptions (number of customers, conversion rate, willingness to pay) and those assumptions have been tested in the field, starting with the most uncertain.
Conclusion
The key points are as follows.
TAM is not a revenue forecast; it is a hypothesis about a business's ceiling and the definition of its market Just as Uber's valuation swung 25-fold on the definition of its market alone, the value lies less in the number itself than in the thinking about "how we define our market." A TAM figure on its own barely predicts success; the quality of the assumptions that make up the TAM, and of the process used to test them, does predict outcomes.
- The VC power law dictates the TAM requirements for startups Because the bulk of returns comes from a few percent of huge hits, VCs demand of every deal "a scale at which a single company can return the fund (TAM above $1 billion)." Conversely, for businesses that do not raise venture capital (such as new ventures inside large corporations), the bar can be far more flexible.
- Bottom-up calculation is the rule. The "1% of a giant market" argument, conflating adjacent markets (Beyond Meat), and confusing stocks with flows (hidden assets) are all read as signals that the thinking has stopped.
- Winners didn't "hit" their TAM—they expanded it Amazon, ServiceNow and Uber grew revenues to several times their declared TAM (200–1,200% attainment), while Quibi and WeWork, which touted enormous TAMs, exited the stage. What separates success from failure is not the size of the market but whether demand actually exists and whether the unit economics work. And the initial wedge market is better the smaller it is—provided it opens onto adjacent markets to expand into.
- For AI agents, TAM is rewritten by an order of magnitude—from "software budgets" to "payroll budgets" As the academic research shows, the bigger a market looks, the more prone it is to overestimation. TAM is not a number you calculate once and set aside; it is a hypothesis to be continually tested against the outside view (the distribution of comparable cases).
References
Academic literature
- Anderson, J. C., & Narus, J. A. (1998). Business marketing: Understand what customers value. Harvard Business Review, 76(6), 53–65.: The paper that laid the foundation for "value theory"—quantifying the value to the customer in monetary terms and using it as the basis for pricing
- Bass, F. M. (1969). A new product growth model for consumer durables. Management Science, 15(5), 215–227.: The paper that presented the classic demand-forecasting model, which predicts a new product's diffusion curve from an innovation coefficient and an imitation coefficient
- Bernstein, S., Korteweg, A., & Laws, K. (2017). Attracting early-stage investors: Evidence from a randomized field experiment. The Journal of Finance, 72(2), 509–538.: A randomized experiment showing that angel investors respond to information about the founding team but not to information about traction or the market.
- Camerer, C., & Lovallo, D. (1999). Overconfidence and excess entry: An experimental approach. American Economic Review, 89(1), 306–318.: The classic experimental paper showing that entrepreneurial overconfidence—especially the tendency to overlook that competitors are just as confident—leads to excess market entry.
- Camuffo, A., Cordova, A., Gambardella, A., & Spina, C. (2020). A scientific approach to entrepreneurial decision making: Evidence from a randomized control trial. Management Science, 66(2), 564–586.: An RCT showing that entrepreneurs trained to test their market hypotheses scientifically achieve better revenue, better exit decisions, and higher-quality pivots.
- Camuffo, A., Gambardella, A., Messinese, D., Novelli, E., Paolucci, E., & Spina, C. (2024). A scientific approach to entrepreneurial decision-making: Large-scale replication and extension. Strategic Management Journal, 45(6), 1209–1237.: A large-scale replication of the "entrepreneur as scientist" effect above, reproduced across 759 companies and four RCTs.
- Cassar, G. (2010). Are individuals entering self-employment overly optimistic? An empirical test of plans and projections on nascent entrepreneur expectations. Strategic Management Journal, 31(8), 822–840.: A paper showing that entrepreneurs who prepare formal financial projections actually end up with a stronger optimism bias.
- Chwolka, A., & Raith, M. G. (2023). Overconfidence as a driver of entrepreneurial market entry decisions: A critical appraisal. Review of Managerial Science, 17(3), 985–1016.: A critical review that revisits the received wisdom that "entrepreneurs are overconfident" and argues that the effects of overconfidence can be either positive or negative.
- Feiler, D., & Tong, J. (2022). From noise to bias: Overconfidence in new product forecasting. Management Science, 68(6), 4685–4702.: A paper showing that the very act of picking the "biggest-looking opportunity" out of a set of noisy demand forecasts produces systematic overestimation.
- Flyvbjerg, B. (2006). From Nobel Prize to project management: Getting risks right. Project Management Journal, 37(3), 5–15.: The paper that formalized "reference class forecasting" (the outside view), which forecasts from the actual outcome distribution of comparable projects.
- Gompers, P. A., Gornall, W., Kaplan, S. N., & Strebulaev, I. A. (2020). How do venture capitalists make decisions? Journal of Financial Economics, 135(1), 169–190.: A survey of 885 institutional VCs showing that "team" outweighs market and technology in deal selection.
- Kaplan, S. N., Sensoy, B. A., & Strömberg, P. (2009). Should investors bet on the jockey or the horse? Evidence from the evolution of firms from early business plans to public companies. The Journal of Finance, 64(1), 75–115.: Tracking companies from their business plans through to IPO, this paper finds that the business itself (the market) stays stable while management teams turn over frequently, and concludes that investors should "bet on the horse" (the market).
- Kerr, W. R., Nanda, R., & Rhodes-Kropf, M. (2014). Entrepreneurship as experimentation. Journal of Economic Perspectives, 28(3), 25–48.: A paper that lays out how venture returns follow an extremely skewed (power-law) distribution and proposes a framework for viewing entrepreneurship as "experimentation."
- Lee, H., Kim, S. G., Park, H., & Kang, P. (2014). Pre-launch new product demand forecasting using the Bass model: A statistical and machine learning-based approach. Technological Forecasting and Social Change, 86, 49–64.: A paper proposing a method that uses machine learning on data from comparable product groups to estimate Bass model parameters before launch.
Books
- Aulet, B. (2013). Disciplined entrepreneurship: 24 steps to a successful startup. Wiley.: Drawing on MIT's entrepreneurship curriculum, this book systematizes bottom-up TAM estimation built up from end-user profiles.
- Blank, S., & Dorf, B. (2012). The startup owner's manual: The step-by-step guide for building a great company. K&S Ranch.: The standard startup management text by the originator of the customer development model, explaining the three-layer decomposition of market size via TAM/SAM.
- Brown, E., & Farrell, M. (2021). The cult of we: WeWork, Adam Neumann, and the great startup delusion. Crown.: An inside account of WeWork by WSJ reporters, depicting how vast amounts of capital can delay negative signals from the market.
- Carreyrou, J. (2018). Bad blood: Secrets and lies in a Silicon Valley startup. Knopf.: An investigative account of the Theranos affair by the WSJ reporter who exposed it, showing how a giant-market narrative can conceal an unfinished technology.
- Kawasaki, G. (2015). The art of the start 2.0: The time-tested, battle-hardened guide for anyone starting anything. Portfolio/Penguin.: The standard pitching handbook that dubbed the "1% of a giant market" argument the "Chinese Soda Lie" and critiqued it.
- Kupor, S. (2019). Secrets of Sand Hill Road: Venture capital and how to get it. Portfolio/Penguin.: A book in which an a16z managing partner explains how VC funds work and the arithmetic of "one company returning the fund."
- Thiel, P., & Masters, B. (2014). Zero to one: Notes on startups, or how to build the future. Crown Business.: A book laying out the power-law investment philosophy and the wedge strategy of "monopolize a small market."
Corporate disclosures
- Airbnb, Inc. (2020). Form S-1 registration statement. U.S. Securities and Exchange Commission.: The IPO prospectus that presented a TAM of $3.4 trillion and a SAM of $1.5 trillion.
- Alphabet Inc. (2026). Q1 2026 earnings release (Form 8-K, Exhibit 99.1). U.S. Securities and Exchange Commission.: Earnings materials disclosing that the cloud business exceeded a $70 billion annualized run rate with 60%+ growth.
- Amazon.com, Inc. (1997). Prospectus (Form 424B1). U.S. Securities and Exchange Commission.: The IPO prospectus that cited a $26 billion U.S. book market and an $82 billion global market as its market size.
- Beyond Meat, Inc. (2019). Prospectus (Form 424B4). U.S. Securities and Exchange Commission.: The IPO prospectus that led with the $1.4 trillion global meat market as its framing device.
- Beyond Meat, Inc. (2026). Beyond Meat reports fourth quarter and full year 2025 financial results [Press release].: The earnings release disclosing 2025 revenue of $276 million (a year-over-year decline).
- Datadog, Inc. (2019). Form S-1 registration statement. U.S. Securities and Exchange Commission.: The prospectus that presented a $35 billion market opportunity by summing Gartner segments.
- HubSpot, Inc. (2014). Form S-1 registration statement. U.S. Securities and Exchange Commission.: The prospectus that framed the market in terms of customer counts: "1.6 million companies in North America plus 1.3 million in Europe."
- Netflix, Inc. (2002). Prospectus (Form 424B4). U.S. Securities and Exchange Commission.: The IPO prospectus that cited the $21 billion U.S. home video market as its market size.
- Palantir Technologies Inc. (2020). Form S-1 registration statement. U.S. Securities and Exchange Commission.: The prospectus presenting a TAM of $119 billion ($63 billion government plus $56 billion commercial)
- Salesforce.com, Inc. (2004). Prospectus (Form 424B1). U.S. Securities and Exchange Commission.: The IPO prospectus citing a $7.1 billion CRM market as its market size
- Slack Technologies, Inc. (2019). Form S-1 registration statement. U.S. Securities and Exchange Commission.: The prospectus that arrived at a $28 billion market opportunity through a bottom-up build by company-size tier
- Snowflake Inc. (2020). Form S-1 registration statement. U.S. Securities and Exchange Commission.: The prospectus presenting an $81 billion TAM by summing IDC market segments
- Uber Technologies, Inc. (2019). Form S-1 registration statement. U.S. Securities and Exchange Commission.: The IPO prospectus presenting a $5.7 trillion TAM (the personal mobility market)
- Uber Technologies, Inc. (2026, February 4). Uber announces results for fourth quarter and full year 2025 [Press release].: The earnings release disclosing 2025 revenue of $52 billion and gross bookings of $193 billion
- Zoom Video Communications, Inc. (2019). Form S-1 registration statement. U.S. Securities and Exchange Commission.: The IPO prospectus presenting a $43.1 billion market opportunity by 2022
- Zoom Video Communications, Inc. (2026). Fourth quarter and fiscal year 2026 financial results. U.S. Securities and Exchange Commission.: Earnings materials showing revenue growth slowing to roughly 4% per year
- WeWork Inc. (2023, November 6). WeWork takes strategic action to significantly strengthen its balance sheet and further streamline its real estate footprint [Press release].: The press release announcing its Chapter 11 bankruptcy filing under U.S. federal law
Industry reports, VC essays and articles
- Axios. (2021, June 8). Katerra's failure is a story of pattern-matching gone wrong.: An article summing up Katerra's bankruptcy as a failure to apply tech-company pattern-matching correctly to the construction industry
- Axios. (2023a, June 12). SoftBank-backed pizza robot startup Zume shuts down after raising $445 million.: An article reporting the shutdown of robotic-pizza startup Zume after it raised $445 million
- Axios. (2023b, October 31). Olive AI is shutting down.: An article reporting the wind-down of healthcare AI company Olive AI, once valued at $4 billion, and revealing that its "automation" actually relied on manual work
- Bloomberg. (2023, December 21). Hyperloop One to shut down after raising millions to reinvent transit.: An article reporting the closure of Hyperloop One, which never exceeded 15% of its promised performance
- Bloomberg. (2026, January 28). AI customer support startup Decagon valued at $4.5 billion.: An article reporting Decagon's funding round at a valuation of roughly 130 times ARR
- CB Insights. (2021). The top 12 reasons startups fail.: A widely cited analysis of post-mortems from 483 startups that identified "no market need" (42%) as the leading cause of death
- CNBC. (2026a, January 6). Elon Musk's xAI raises $20 billion from Nvidia, Cisco investors.: An article reporting xAI's $20 billion raise (at a valuation of roughly $230 billion)
- CNBC. (2026b, March 25). Legal AI startup Harvey raises $200 million at $11 billion valuation.: An article reporting Harvey's raise at an $11 billion valuation and the growth of the legal AI market
- Corporate Finance Institute. (n.d.). Total addressable market (TAM).: A practitioner-oriented primer defining the three approaches to calculating TAM (top-down, bottom-up and value theory)
- Damodaran, A. (2014, June 18). Uber isn't worth $17 billion. FiveThirtyEight.: The article that valued Uber at $5.9 billion using a "global taxi market × 10% share" framework, sparking the TAM debate
- Evans, B. (2016, April 28). In praise of failure. Benedict Evans.: An analysis by the former a16z partner drawing on 7,000 Horsley Bridge deals to show the power law of VC returns, in which 6% of deals generate 60% of returns
- Fortune. (2023, October 19). Convoy, a trucking tech startup backed by Jeff Bezos, shuts down.: An article reporting the abrupt shutdown of Convoy, which had pointed to an $800 billion trucking market
- Fortune. (2026, June 1). Anthropic confidentially files IPO at $965 billion valuation.: An article reporting Anthropic's confidential IPO filing at a $965 billion valuation
- Foundation Capital. (n.d.). The AI hype: $600B question or $4.6T+ opportunity?: A VC essay estimating the AI opportunity at $4.6 trillion, the combined total of labor costs and BPO spending
- Gurley, B. (2014, July 11). How to miss by a mile: An alternative look at Uber's potential market size. Above the Crowd.: The landmark rebuttal in the TAM debate, arguing that Damodaran's valuation could be off by a factor of 25 because the market itself would expand
- Hospitalogy. (2023, May 16). The downfall of Babylon Health.: An article analyzing the collapse of Babylon Health's unit economics, under which every additional patient deepened its losses
- Huang, S., & Grady, P. (2024, October). Generative AI's act o1: The agentic reasoning era begins. Sequoia Capital.: A VC essay that coined "Service-as-a-Software" and reframed the AI opportunity as a services market on the order of $10 trillion
- Kerrisdale Capital. (2012, November 15). ServiceNow, Inc. short thesis.: A short-seller report that sized ServiceNow's core market at roughly $1.5 billion and argued the market was too small (a prediction that later proved badly wrong)
- Levine, S. (2014, August 12). Venture outcomes are even more skewed than you think. VC Adventure.: An analysis of 21,640 Correlation Ventures deals showing the distribution of VC returns: 65% lost money and only 4% returned more than 10x
- NBC News. (2020, October 22). A look at why Quibi failed so soon after launching.: An article analyzing why Quibi, which raised $1.75 billion, wound down just six months after launch
- OpenAI. (2026, March). Accelerating the next phase of AI [Blog post].: The official blog post announcing a major funding round at an $852 billion valuation
- Sequoia Capital. (2026, March). Services: The new software.: A VC essay arguing that "the next trillion-dollar company will sell the work itself" and showing a 1:6 ratio of software to services spending
- TechCrunch. (2023, August 31). The fall of Babylon: Failed tele-health startup once valued at nearly $2B goes bankrupt and sold for parts.: An article reporting the bankruptcy and asset sale of Babylon Health, which had gone public via SPAC
- TechCrunch. (2026, April 17). Cursor in talks to raise $2B at $50B valuation as enterprise growth surges.: An article reporting Cursor's rapid ARR growth and its talks to raise funding at a $50 billion valuation
- Toptal. (n.d.). TAM methodology: An explanation and example of total addressable market analysis.: A practitioner-oriented article explaining TAM calculation methods, including value theory, with worked examples
- Valuentum Securities. (n.d.). Beyond Meat's market: $5 billion or $1.5 trillion?: An analysis published around Beyond Meat's IPO arguing that its market should be measured as the $5 billion plant-based meat category, not the $1.5 trillion meat market
- Yahoo Finance. (2022). MoviePass' former CEO just pleaded guilty to securities fraud.: An article reporting the collapse of MoviePass's unit economics and its executives' guilty pleas to securities fraud
- Ministry of Economy, Trade and Industry (METI). (2024). FY2023 Market Survey Report on E-Commerce.: A government survey estimating the annual transaction value (flow) of the C2C marketplace-app market.
- Minna no Kakure Shisan (Everyone's Hidden Assets) Survey Committee. (2018). Everyone's Hidden Assets Survey [survey press release]. Mercari.: A survey release estimating the total value (stock) of unused items sitting idle in Japanese households.
The end
Read next ↓