
Articles
OMTM and KPI Targets for Startups and New Ventures at Each Stage
Product
Career
Automatically translated from the Japanese original.
Introduction
When you launch a startup or a new business, what goals should you actually be working toward?
This article sets out, for each growth stage of a startup or new venture, what you should measure and what level you should aim for, drawing on internationally recognized literature, columns by seasoned practitioners, and the latest benchmark surveys.
A startup or new business is, at heart, a bundle of unverified hypotheses. You test them one at a time, starting with the ones carrying the greatest uncertainty and risk. Only once every hypothesis has been validated in sequence and every target level has been met does the venture become a complete, functioning business.
For each stage below, we lay out the hypotheses (the questions the venture must answer to be viable as a business), the KPIs (the metrics that evaluate those questions quantitatively), and the OMTM (the "One Metric That Matters"—the single most important KPI at that stage).
In practice, the leadership team owns the OMTM while each function takes responsibility for its own KPIs, and everyone works toward hitting their respective targets.
Stage 1: Customer Discovery & Product Discovery (Pre-founding / Pre-seed)
This is the stage where you identify the problem customers genuinely face and look for signs of Problem-Solution Fit—a match between that problem and your proposed solution. Hardly any quantitative data exists at this point, so the insights gathered from qualitative interviews become your primary data source (Croll & Yoskovitz, 2013).
Problem hypothesis: Do target customers have a problem serious enough that they would pay to solve it?
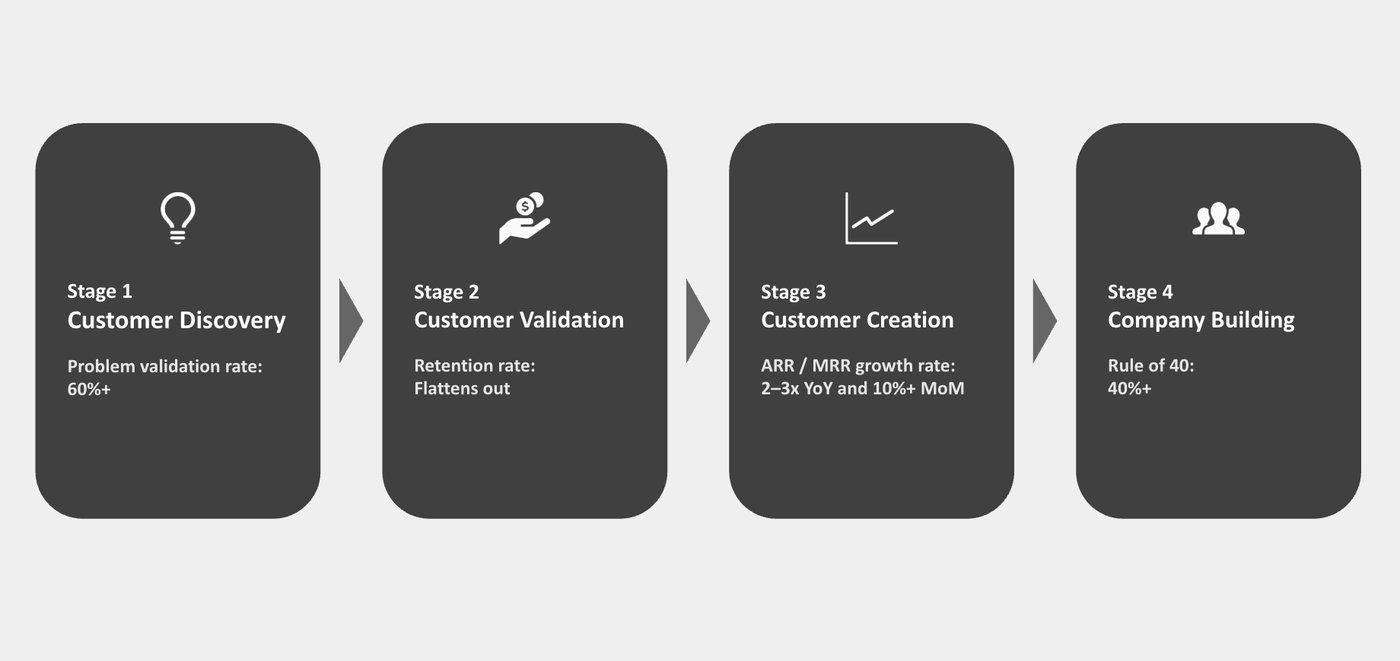
Problem validation rate (*OMTM): the number of interviews in which the problem was confirmed, divided by the total number of interviews. Aim for 60% or higher across a cumulative 30 or more interviews. This is the primary metric for testing the core of your hypothesis—whether the problem really exists—and a low score is a signal to pivot.
Spending and time on existing alternatives: the money and effort customers are already investing to solve the problem today. Fitzpatrick (2013) advises asking about past behavior and spending rather than opinions. If you find existing spend that exceeds your intended price, or more than 10 hours of effort per month, that is a strong leading indicator of willingness to pay.
Presence of homegrown hacks: the share of customers who have cobbled together or modified existing tools on their own to address the problem. Blank & Dorf (2012) list "having built a makeshift solution themselves" as one of the hallmarks of enthusiastic early customers. If you observe this in roughly 30% of target customers, it is a clear sign of strong need.
Customer hypothesis: Can you identify the early customers (evangelists) who feel the problem most acutely?
Number of prospects (LOIs / intent to order): the number of specific prospective customers highly likely to place an order at full price (an LOI is a letter of intent to purchase). For B2B, the benchmark is at least five companies (Blank & Dorf, 2012).
Number of evangelist customers identified: the number of passionate early customers who will buy into your vision and purchase even before the product is finished. The benchmark is to have identified three to five companies and built relationships with them.
Value hypothesis: Does your concept solve the problem and attract interest?
NPS (Net Promoter Score): a measure of willingness to recommend, calculated from responses to "How likely are you to recommend this product to others?" (the percentage of promoters minus the percentage of detractors). As a proxy for how much customers care about the problem, aim for 50 or above (Blank & Dorf, 2012).
Prototype usability success rate: the share of participants in user testing who complete the key tasks. Aim for 80% or higher. Of the four risks Cagan (2018) describes—value, usability, feasibility, and business viability—the first two are the ones you validate with a prototype.
(B2C) Early engagement behavior: behavioral data such as return rates and invitation rates. Benchmarks include a return rate of 20% or higher within one week and sign-ups arriving via invitations (Blank & Dorf, 2012).
Market hypothesis: Is the market large enough for venture-scale returns?
TAM / SAM / SOM: a three-layered estimate of market size—the theoretical ceiling, the portion your company can realistically reach, and the share you can actually capture within a few years. If you plan to raise from VCs, your TAM should be on the order of hundreds of billions of yen.
Learning-velocity hypothesis: Are you running validation cycles fast enough?
Number of iterations / interviews: how many validation cycles and customer conversations you complete per unit of time. Under uncertainty, learning fast is a competitive advantage in itself. Aim for five or more interviews per week and weekly hypothesis updates (Ries, 2011).
Stage 2: Customer Validation (Seed)
This is the stage where you actually sell your initial product to customers and demonstrate both PMF (product-market fit—the state in which the market is embracing your product) and a viable business model. Before investing in growth, you first have to prove that users stick around (Croll & Yoskovitz, 2013).
PMF hypothesis: Do customers value the product so much that they would struggle without it?
Retention rate / churn (*OMTM): the retention and cancellation rates for each cohort of customers acquired in the same period. The sign of PMF is a retention curve that stops decaying and flattens out. Investing in acquisition before you have proven retention is like pouring water into a leaky bucket.
PMF score (the Sean Ellis test): the share of users who answer "very disappointed" to the question "How would you feel if you could no longer use this product?" The threshold is above 40%. Based on a study of roughly 100 companies, Ellis found that 40% is the line separating companies that go on to grow from those that do not (Ellis, 2017). The email client Superhuman published its process for raising this score from 22% to 58%, showing how important it is to narrow your segment and deliberately disregard feedback from users who score low (Vohra, 2018).
Stickiness (DAU/MAU): the share of monthly active users who use the product every day. For a product meant for daily use, 40% or higher is a strong signal.
Monetization hypothesis: Will customers pay full price?
Number of full-price orders: the number of orders won at list price with no discount. Aim for three to five from evangelist users (Blank & Dorf, 2012).
Number of reference customers: the number of customers you can present to others as success stories. Once you have six, you can declare PMF in that market (Blank & Dorf, 2012).
LTV/CAC (unit economics): the ratio of the lifetime profit earned from a single customer (LTV) to the cost of acquiring that customer (CAC). A ratio of 3 or higher is considered healthy. The latest field data puts the median among surveyed companies at around 3.6 (Benchmarkit, 2025).
Gross margin: profit as a share of revenue after subtracting cost of goods sold. For SaaS, aim for 70% or higher (for AI-native products, see the later chapter).
Activation hypothesis: Do new customers reach the core value (the "aha" moment)?
Activation rate: the share of customers who sign up and go on to experience the product's core value for the first time.
Time to Value: the time from sign-up to first experiencing the core value. The shorter it is, the better your retention (Croll & Yoskovitz, 2013).
Capital-discipline hypothesis: Can you avoid burning through your cash before reaching PMF?
Burn rate / runway: burn rate is the amount of cash you spend each month; runway is the number of months you can survive on the cash you have. Do not invest heavily in sales and marketing before achieving PMF (Blank & Dorf, 2012). Graham (2015) argues that every founder should be able to answer instantly whether, given current spending and growth rates, the company will reach profitability before its cash runs out—that is, whether it is "Default Alive" or "Default Dead."
Stage 3: Customer Creation (Series A)
This is the stage where you cross the chasm—the gap between the early market and the mainstream market—and expand into the mainstream (Moore, 1991). What is being tested here is whether you have a repeatable customer-acquisition engine and whether each customer is profitable on a per-customer basis.
Acquisition-scale hypothesis: Can a repeatable acquisition engine win the mainstream market?
ARR / MRR growth rate (*OMTM): how much recurring revenue has grown compared with the previous period. The growth benchmark for top SaaS companies is T2D3, proposed by Battery Ventures' Agrawal: after reaching ARR of ¥100–200 million, triple, triple, then double, double, double, aiming for roughly ¥10 billion in ARR within five to six years (Agrawal, 2015). The rule of thumb is 2–3x year over year, or 10% or more month over month. However, unless you read this alongside supporting metrics that gauge the quality of growth (burn multiple, NRR), you cannot tell it apart from simply burning cash to buy growth.
CAC payback period: the number of months it takes to recover the cost of acquiring a customer from the gross profit that customer generates. 12 months or less is considered good, but recent surveys show the median has deteriorated to around 20 months (Benchmarkit, 2025), which makes 12 months a top-tier result.
Magic number: a measure of sales efficiency calculated as net new ARR in the current quarter divided by sales and marketing spend in the previous quarter. Proposed by Scale Venture Partners, a value of 0.75 or higher is taken as a signal that it is safe to scale up sales investment.
Sales funnel predictability: the stability of stage-by-stage conversion rates, win rates, average contract value, and sales cycle length. The benchmark is being able to forecast quarterly revenue to within roughly ±10% (Blank & Dorf, 2012).
Viral coefficient (k): the number of new users each existing user brings in. For PLG and B2C products, a value of 1.0 or higher means growth becomes self-sustaining (Croll & Yoskovitz, 2013).
Retention and expansion hypothesis: Does revenue per customer grow faster than churn erodes it?
NRR (net revenue retention): the percentage change over one year in revenue from existing customers alone, after adding upsells and subtracting churn. Anything above 100% is essentially mandatory; 110% or higher is good, and 120% is excellent. The recent median has slipped to around 101% (Benchmarkit, 2025), so anything above 110% already places you in the upper tier.
Churn (logo / revenue): cancellation rates measured by customer count and by revenue. Aim for monthly logo churn of 1% or less and annual revenue churn of 10% or less.
Expansion revenue rate: The share of revenue that comes from additional sales to existing customers (upsells and cross-sells). The ideal is "net negative churn," where expansion revenue more than offsets the revenue lost to cancellations.
Capital efficiency hypothesis: Are we growing efficiently?
Burn multiple: How much net new ARR you generate for every yen of cash burned (net cash burn ÷ net new ARR). Proposed by Sacks as a measure of the "quality of growth," the rule of thumb is: under 1 is outstanding, 1–1.5 is good, 2–3 is questionable, and above 3 is dangerous (Sacks, 2020).
Runway: The number of months you can survive on the cash you have. The conventional wisdom is to keep 18–24 months in hand.
Funding discipline hypothesis: Can we reach profitability without raising another round?
Default Alive / Default Dead: A determination of whether, with no additional funding and at your current growth rate, you can reach profitability before the money runs out. Graham (2015) warns that founders tend to mistakenly assume they are Default Alive, and so notice the danger too late.
Stage 4: Company building (Series B and beyond)
This is the stage where you scale the business to a sustainable size and make the company profitable as a whole.
Sustainable efficient growth hypothesis: Can we deliver growth and profitability at the same time?
Rule of 40 (*OMTM): Revenue growth rate plus profit margin, with 40% or more as the target. Because it captures the balance between growth and profitability in a single number, it is well suited as the OMTM for the mature stage. Recent benchmarks put the median for B2B SaaS at around 25% and the top quartile at roughly 43% (Benchmarkit, 2025, among others), so exceeding 40% clearly places a company in the top tier.
Operating margin / EBITDA / net income: The set of metrics that measure what the business ultimately earns. The bar to clear is positive bottom-line profit for the company as a whole (Blank & Dorf, 2012).
Free cash flow (FCF): The cash left over after subtracting investment from the cash generated by operations. Once FCF turns positive, you can fund growth investments from your own resources regardless of market conditions.
Expansion engine hypothesis: Does our existing base keep generating growth?
NRR (expansion): Your ability to grow revenue from existing customers, with 120% or higher as the target. In the mature stage, the main source of growth is no longer new customer acquisition but expansion within the existing base.
LTV and gross margin by cohort: Long-term profitability broken down by when customers were acquired. The test of health is that each newer cohort performs better than the last (Croll & Yoskovitz, 2013).
Business portfolio hypothesis: Do we have a winning formula in each segment?
Unit economics by segment / product: The profitability of each part of the business. The target is an LTV/CAC ratio of 3 or higher across all major segments; unprofitable segments become candidates for exit.
Market share / customer concentration: Your share of the market, and how dependent your revenue is on large accounts. As a guideline for managing concentration risk, keep your top 10 customers at no more than 30% of revenue.
Organizational scale hypothesis: Can we maintain organizational efficiency and talent density?
Revenue per employee: Revenue ÷ headcount. This is the metric that guards productivity as you scale.
eNPS / attrition rate: eNPS is the employee version of NPS, asking whether people would recommend the company as a place to work. Together with attrition, it measures talent density and the sustainability of the organization (Cagan & Jones, 2021).
KPIs specific to industry-focused AI agents
Everything up to this point has covered metrics for startups and SaaS businesses in general. If you are building an industry-specific AI agent, however, conventional SaaS metrics alone will not capture what is really happening in the business. An AI agent does not so much "sell software" as "take over the work itself," which means you also need metrics for how much human labor you have actually replaced and for the cost structure unique to AI. Drawing on our own experience at mign, the main ones are as follows.
Automation rate: The share of target tasks that the AI completes end to end with no human involvement whatsoever. This metric goes to the heart of the labor-replacement value proposition; aim for 50% or more to begin with, then raise the bar in stages. If a large share of cases still requires a person to check and correct the output, what you really have is a human-powered service wearing an AI label, and neither your gross margin nor your scalability will reach SaaS levels.
Accuracy (rate of output needing no rework): The share of AI output that could be used as-is, without human correction. The target is 90% or higher. Accuracy is a prerequisite for the automation rate and feeds directly into customer trust and churn. For an industry-specific product, how much more accurate you are than a general-purpose model within your own domain is the source of your differentiation.
Value KPI (labor-hour reduction rate): How much you have cut the labor hours a customer spends on the target task compared with before adoption. The target is 50% or more. Because pricing for AI agents is moving away from seat counts and toward value-based models tied to hours saved and work replaced, this metric becomes the foundation for your pricing.
AI cost ratio: AI-related costs (LLM API fees, inference costs, and so on) as a share of revenue. Manage this to 30% or below. Research by ICONIQ Capital finds that at AI companies in the scaling phase, inference costs alone account for roughly 23% of revenue, and Bessemer Venture Partners reports gross margins for AI companies of around 50–60% (versus 70–90% for mature SaaS). At the same time, a16z has pointed to "LLMflation," the roughly tenfold annual decline in inference cost for equivalent performance. The AI cost ratio is therefore a metric to judge less by how low it is today than by whether your architecture is designed to ride that downward trend.
Accumulated training data: The volume of industry-specific data and knowledge (number of records, breadth of coverage) that builds up as you process real work. This metric tracks your progress toward being hard to imitate—your moat. The better general-purpose models become, the more your defensibility shifts away from the model itself and toward industry data that others do not have and embedding in customer workflows. Check alongside it that a working loop exists in which this accumulated data actually translates into accuracy improvements.
Usage growth and two-sided expansion: Growth in monthly processing volume, and the spread of usage to both sides of a workflow (for example, the reviewing side and the applying side). Unlike seat-based pricing, expansion revenue for AI agents comes from increases in processing volume, so this metric serves as a leading indicator for NRR.
Conclusion
Summed up in a single line, the OMTM for each stage progresses as follows: problem validation rate → retention → ARR growth rate → Rule of 40.
What matters is to determine which stage your business is in right now, and to focus the team squarely on the OMTM for that stage.
References
Agrawal, N. (2015). The SaaS adventure. Battery Ventures/TechCrunch. (An investor column proposing "T2D3," the growth path by which a SaaS company reaches roughly ¥10 billion in ARR.)
Benchmarkit. (2025). 2025 B2B SaaS performance metrics. (An annual benchmark study covering more than 900 B2B SaaS companies, publishing medians for NRR, CAC payback, and other metrics.)
Blank, S. G. (2006). The four steps to the epiphany. Steven G. Blank. (The original source of the "customer development model," with its four stages from customer discovery through company building.)
Blank, S., & Dorf, B. (2012). The startup owner's manual. K&S Ranch. (A startup textbook that turns the customer development model into concrete procedures and checklists.)
Cagan, M. (2018). Inspired (2nd ed.). John Wiley & Sons. (The standard textbook on product management, including the four risks of value, usability, feasibility, and business viability.)
Cagan, M., & Jones, C. (2021). Empowered. John Wiley & Sons. (A practical guide to building strong product organizations and talent density.)
Croll, A., & Yoskovitz, B. (2013). Lean analytics. O'Reilly Media. (The definitive book on data-driven practice, introducing the OMTM concept and a framework of metrics by stage and business model.)
Ellis, S. (2017). Using product/market fit to drive sustainable growth. Growth Hackers. (A column explaining the Sean Ellis test, which sets 40% of users saying they would be "very disappointed" without the product as the threshold for PMF.)
Fitzpatrick, R. (2013). The mom test. CreateSpace. (A guide to customer interviewing techniques that ask about past behavior and spending rather than opinions.)
Graham, P. (2015). Default alive or default dead? (An essay by the Y Combinator founder asking whether a startup can reach profitability without raising additional funding.)
Moore, G. A. (1991). Crossing the chasm. HarperBusiness. (The classic work on the "chasm" between the early market and the mainstream market, and how to cross it.)
Ries, E. (2011). The lean startup. Crown Business. (The original text of the lean startup movement, known for the build-measure-learn loop and its warning against vanity metrics.)
Sacks, D. (2020). The burn multiple. Craft Ventures. (An investor column proposing the burn multiple, which measures the "quality of growth" as net new ARR per unit of cash burned.)
Scale Venture Partners. (n.d.). A primer on SaaS sales efficiency. (An explainer from the VC firm that proposed the "magic number" for measuring the efficiency of sales and marketing spend.)
Vohra, R. (2018). How Superhuman built an engine to find product/market fit. First Round Review. (A column laying out the hands-on process by which Superhuman raised its Sean Ellis test score from 22% to 58%.)
The end
Read next ↓