
Articles
The era of AI agents autonomously controlling BIM: History and future of CAD and BIM according to latest research
Product
Career
Automatically translated from the Japanese original.
Introduction
AI is steadily becoming part of everyday life and work, and the architecture and civil engineering fields are no exception: expectations for AI are running high across a wide range of tasks. Among them, the long-anticipated automation of design by AI is finally becoming a realistic prospect. Against this backdrop, it is worth taking a fresh look at how digital tools such as CAD (Computer-Aided Design) and BIM (Building Information Modeling) have historically reshaped work in the architecture and civil engineering industries, and, drawing on the latest academic research, considering where things are headed next.
A History of CAD and BIM: BIM Is Not the Successor to CAD
This section traces the history of CAD and BIM. One point needs to be understood from the outset: CAD and BIM come from different lineages, so BIM is not the successor to CAD. The most important distinction is that CAD is a general-purpose tool used well beyond architecture and civil engineering, whereas BIM is a tool built specifically for the architecture and civil engineering fields.
The History of CAD
1950s–1960s: The Birth of the Concept and of SKETCHPAD
Technology for defining shapes mathematically: The technical roots of CAD go back to the late 1950s and the demand for manufacturing automation in the military and aerospace industries. At the Massachusetts Institute of Technology (MIT), the development of APT, an automatic programming tool for numerically controlled (NC) machine tools, laid the groundwork for the mathematical definition of geometry. (Ball, 2013; Weisberg, 2008)
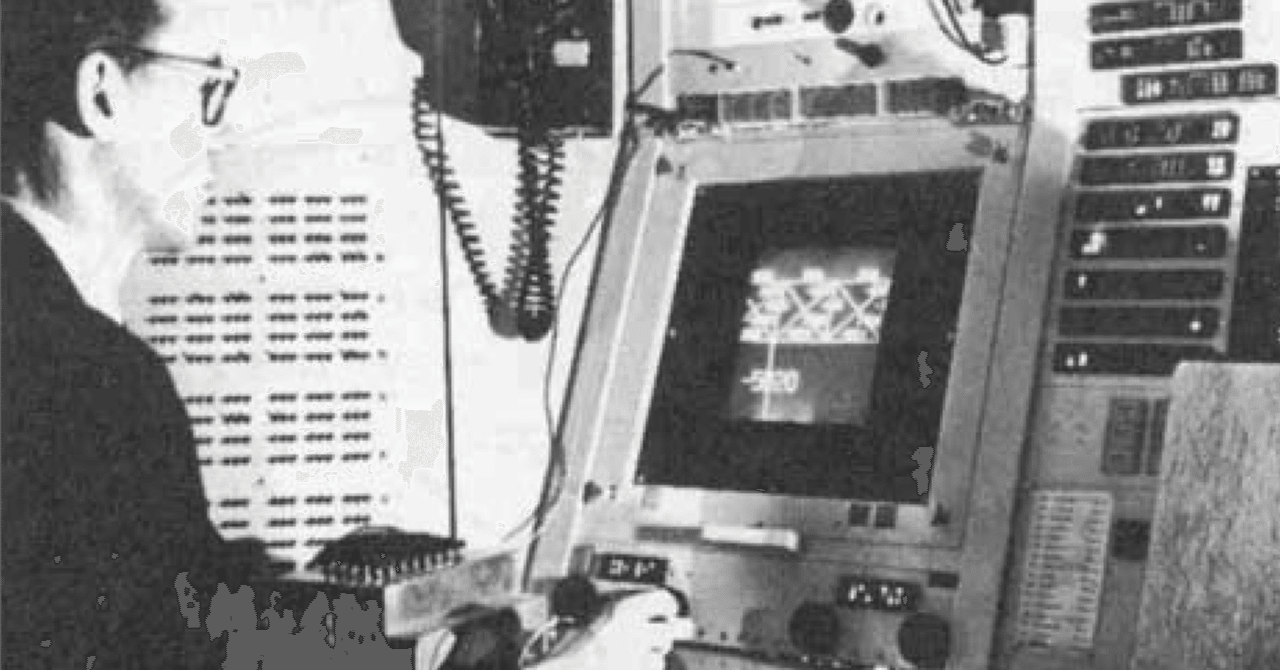
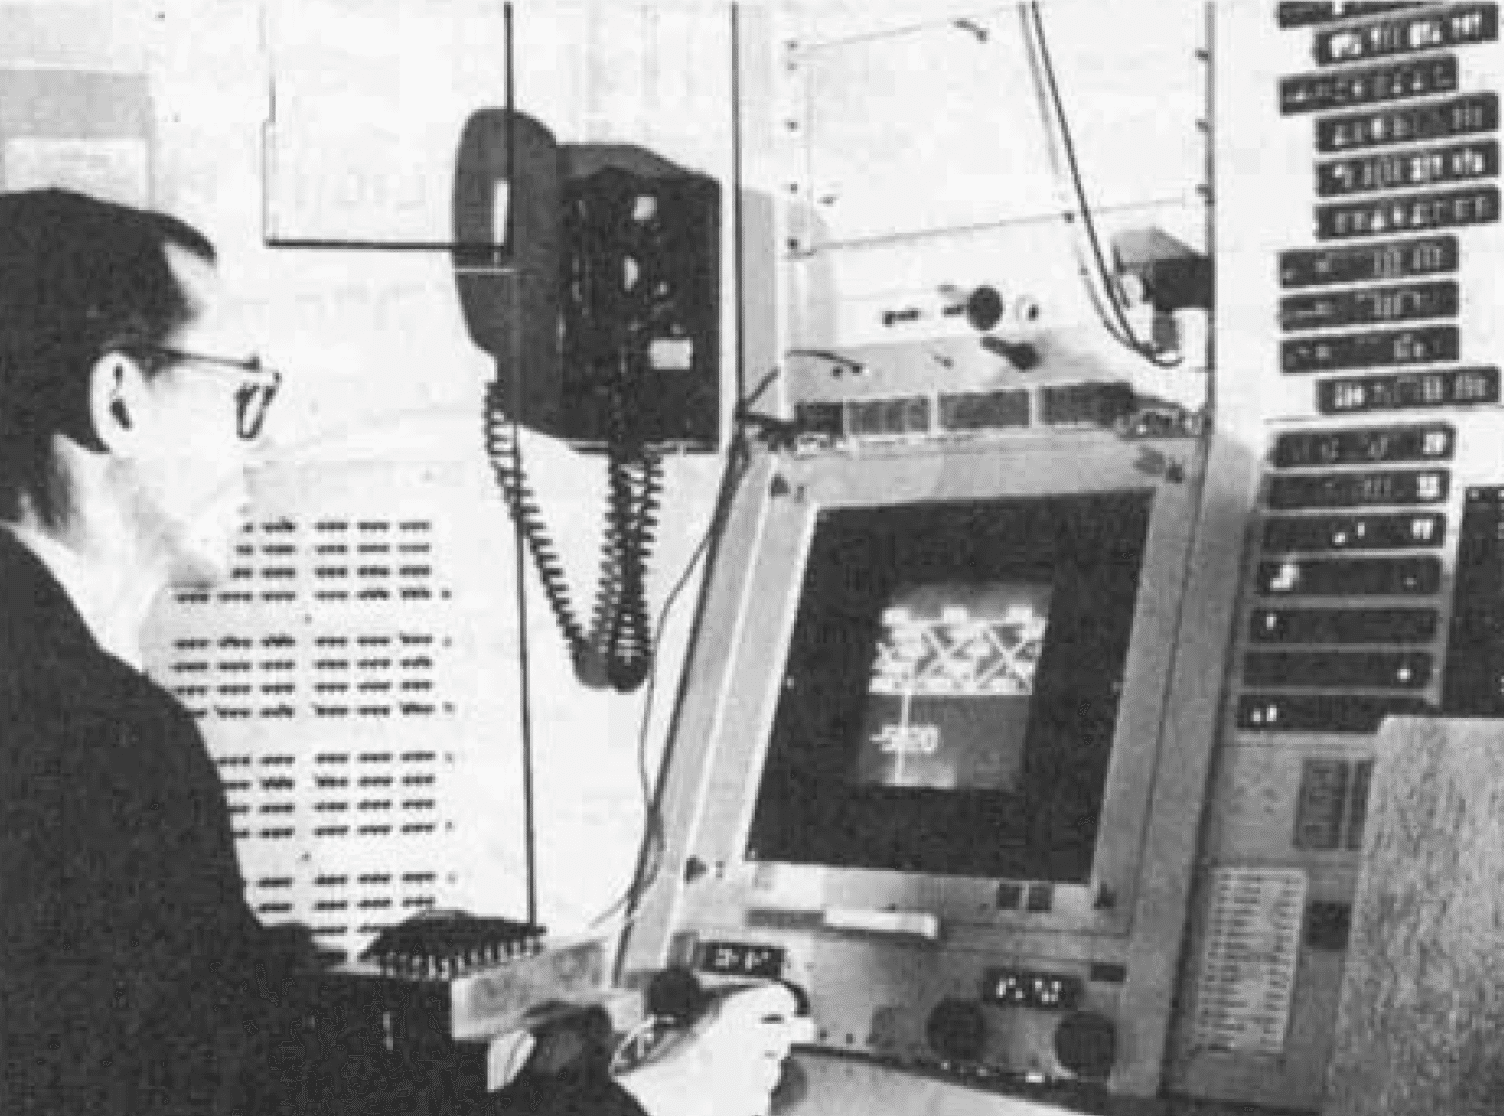
The development of SKETCHPAD: The true ancestor of modern CAD is Sketchpad, developed in 1963 by Ivan Sutherland at MIT as part of his doctoral research. Using a cathode ray tube (CRT) display and a light pen, the system allowed users to draw and manipulate shapes interactively on a computer and to apply geometric constraints—rules that define and restrict the relative positions and shape relationships between elements such as points, lines, and surfaces. It was a groundbreaking achievement. (Alin & Stăncioiu, 2024; Tornincasa & Monaco, 2010; Weisberg, 2008; Wolfe, July-Sep 2025)
In-house systems at major corporations: During the 1960s, large companies in the automotive and aircraft industries began building their own 2D/3D systems on mainframe computers. Representative examples include DAC-1 at General Motors (GM), CADAM at Lockheed, and UNISURF at Renault. (Tornincasa & Monaco, 2010; Weisberg, 2008)
1970s: The Rise of Commercial Turnkey Systems and the Establishment of the Fundamentals
The dawn of the commercial market: The founding of Applicon and Computervision in 1969 marked CAD's move out of the research lab and into the commercial market. They were followed by other early leaders such as Auto-trol, Calma, and Intergraph. (Weisberg, 2008; Wolfe, July-Sep 2025)
Delivery as turnkey systems: The CAD systems of the era were sold as turnkey systems—ready to use the moment you "turned the key" and powered them on—that bundled a minicomputer (such as DEC's PDP-11) with a storage tube display and a digitizer. At more than $150,000 per seat, they were extremely expensive, which kept the technology largely confined to big corporations. (Weisberg, 2008; Wolfe, July-Sep 2025)
The father of CAD/CAM and the first stirrings of solid modeling: MCS, founded by Patrick Hanratty, developed design and manufacturing software such as ADAM and licensed it to numerous vendors, laying the foundation for the spread of CAD. In the same period, Ian Braid and others advanced the fundamental research behind solid modeling—the creation of "filled-in" 3D solids—including boundary representation (B-Rep) and constructive solid geometry (CSG). (Ball, 2013; Weisberg, 2008)
1980s: The Spread of the PC and the Arrival of AutoCAD
Democratization through PC CAD: When hardware prices fell dramatically in the 1980s, the structure of the CAD market changed completely. In 1982, Autodesk released AutoCAD, an inexpensive package for personal computers (PCs). It put CAD within reach of small and mid-sized firms and individual designers who had previously been unable to adopt it, and it went on to become the de facto industry standard. (Tornincasa & Monaco, 2010; Weisberg, 2008)
The shift to workstations: Meanwhile, companies with more demanding processing needs migrated from mainframes to UNIX-based engineering workstations from vendors such as Apollo and Sun Microsystems. (Weisberg, 2008; Wolfe, July-Sep 2025)
The arrival of feature-based parametric design: In 1987, Parametric Technology Corporation (PTC) unveiled Pro/ENGINEER. This revolutionary system recorded the user's design steps as a history, so that simply changing a parameter (variable) such as a dimension would automatically update the entire model. It represented a major paradigm shift—often called the fifth generation of the CAD industry—and its impact was great enough to render existing systems obsolete. (Tornincasa & Monaco, 2010; Weisberg, 2008)
1990s–2000s: The Rise of Mid-Range CAD and the Evolution toward Direct Modeling
Windows-based mid-range 3D CAD: By the mid-1990s, improvements in the performance of the Windows OS and Intel processors enabled the emergence of affordable, user-friendly Windows-based mid-range 3D CAD systems (sitting between the high-end and low-end tiers), such as SolidWorks (1995) and Solid Edge (1996). These steadily captured market share from expensive UNIX workstations. (Tornincasa & Monaco, 2010; Wolfe, July-Sep 2025)
Direct modeling technology: For all its power, parametric modeling had a weakness: once the initial constraints became overly complex, it was difficult for anyone else to modify the model. In response, the late 2000s saw the rise of direct modeling (history-free) technology, which lets users manipulate faces and edges directly and intuitively without being bound by a history tree. Today, hybrid CAD systems that combine the strengths of both approaches have become the mainstream. (Tornincasa & Monaco, 2010)
Integration into PLM: Modern CAD has grown beyond a mere geometric modeling tool. It now functions as the core of analysis (Computer-Aided Engineering, CAE), manufacturing (Computer-Aided Manufacturing, CAM), and the Product Lifecycle Management (PLM) systems that manage a product across its entire life cycle. (Weisberg, 2008; Wolfe, July-Sep 2025)
Expansion into BIM: In the architecture and construction fields, this evolved into Building Information Modeling (BIM), which carries attribute information and serves as a comprehensive information platform spanning everything from design to operations and maintenance. (Sacks et al., 2018)
The History of BIM
1960s–1970s: The Birth of the Concept and the Development of Prototypes
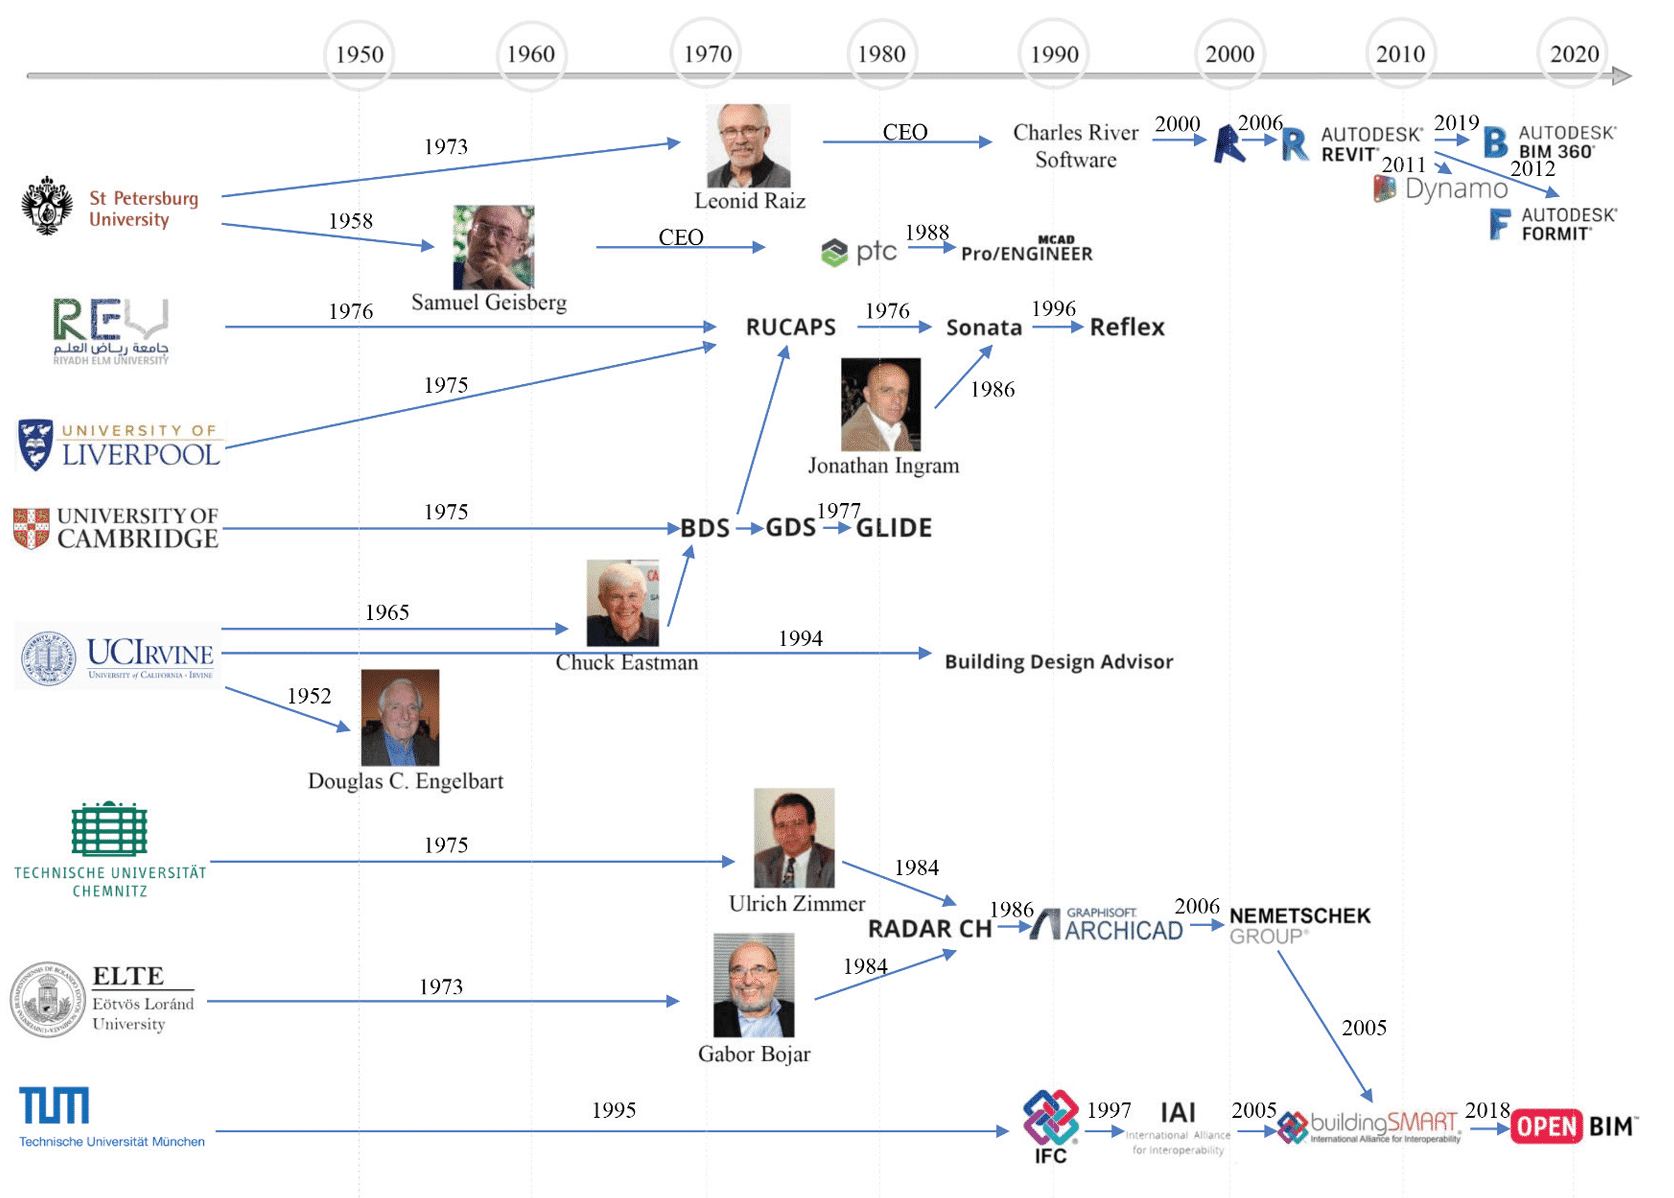
Foreseeing parametric design: In his paper "Augmenting Human Intellect," Douglas C. Englebart envisioned a future in which architectural design would be carried out using object-based parametric elements. (Borkowski, 2023; Hız et al., 2023)
The template concept: The architect Christopher Alexander proposed the concept of templates for automating the design process, laying the foundation for an object-oriented approach (an idea that would later lead to his pattern language). (Alexander, 1977; Borkowski, 2023)
The father of BIM develops its forerunner: Charles M. Eastman and his colleagues at Carnegie Mellon University developed and published the Building Description System (BDS), the world's first software built on the logic that underpins today's BIM. BDS was a groundbreaking system: it maintained a continuously updated database of materials, supplier information, and more, and could automatically and consistently generate floor plans, elevations, perspectives, and other views from a single description. Following BDS, Eastman developed GLIDE, which was built on the same logic, continuing his proof of concept for information modeling across the building life cycle. (Hız et al., 2023)
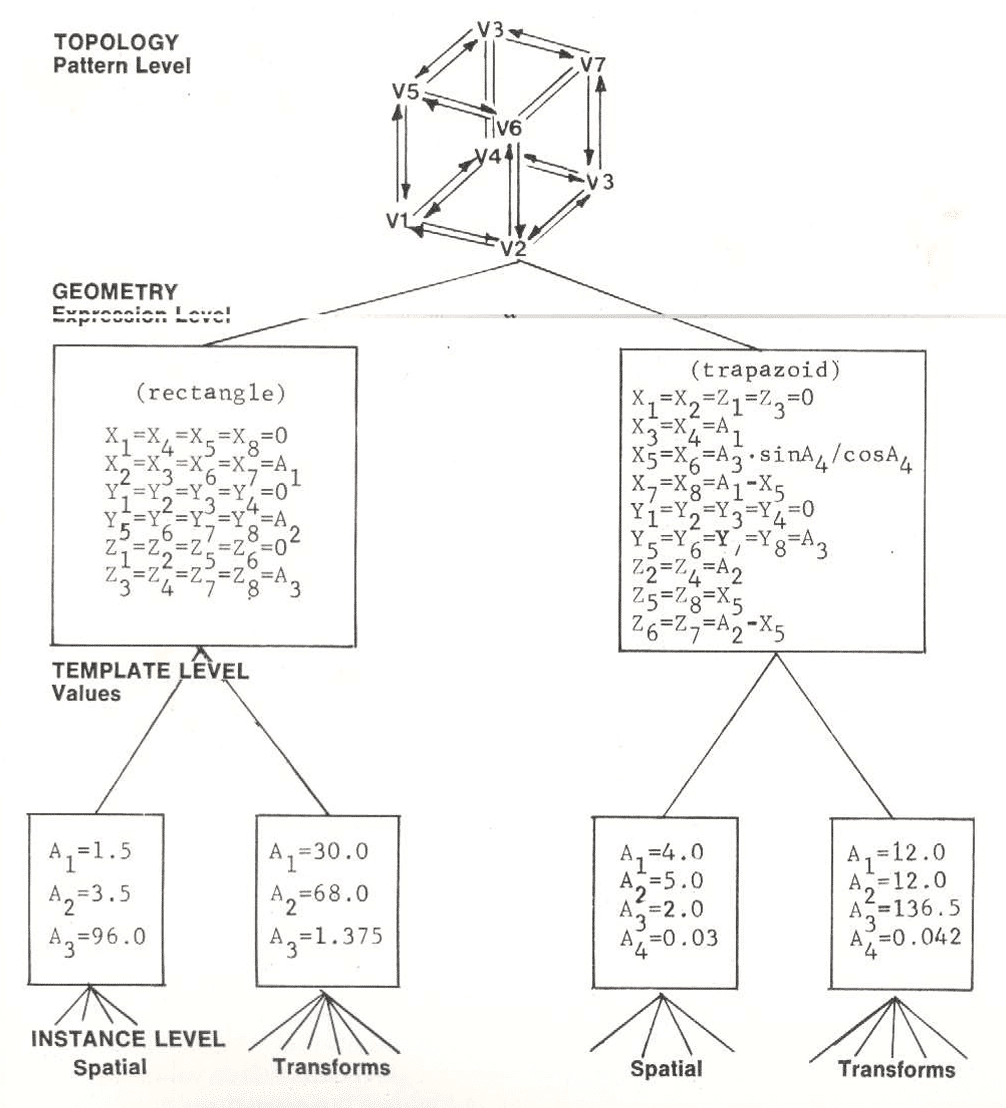
1980s: The Dawn of Commercialization and the Emergence of "Building Modeling"
The release of Radar CH (later ArchiCAD): Hungary's Graphisoft released Radar CH (later ArchiCAD), which offered an object-based 3D approach without relying on expensive workstations. Around the same time, pioneering systems such as RUCAPS and SONATA were being developed in the United Kingdom. (Borkowski, 2023; C. Eastman et al., 2008)
Defining the essential requirements of BIM: In a paper on the refurbishment of London Heathrow Airport using RUCAPS, Robert Aish became the first to describe what we now know as BIM, under the term "Building Modelling." The paper already clearly set out the essential requirements of modern BIM: 3D modeling, parametric components, relational databases, and time-based phasing of the construction process. (Borkowski, 2023; C. Eastman et al., 2008; Hız et al., 2023)
The 1990s: The birth of the term "BIM" and the challenge of interoperability
The term BIM is coined: G.A. van Nederveen and F.P. Tolman published the paper "Modelling multiple views on buildings." It is widely recognized as the first academic publication to use the acronym "Building Information Model (BIM)." (C. Eastman et al., 2008; Hız et al., 2023)
Founding of the IAI (later buildingSMART): With every vendor maintaining its own proprietary data format, exchanging data across disciplines (interoperability) became a major barrier. To address this, a consortium of companies led by Autodesk was formed, and in 1995 the IAI (International Alliance for Interoperability, now buildingSMART) was formally established. (C. Eastman et al., 2008; Hız et al., 2023; Laakso & Kiviniemi, 2012; Sacks et al., 2018)
Release of IFC: The IAI released the first version of IFC (Industry Foundation Classes), a vendor-neutral open data standard (IFC 1.0), laying the technical foundation for collaboration across disciplines. (Hız et al., 2023)
The 2000s: Becoming an established industry standard
The birth of Revit: Charles River Software developed Revit, built around a powerful parametric change engine (the company was acquired by Autodesk in 2006). (C. Eastman et al., 2008; Hız et al., 2023)
The term BIM goes global: Through the work of prominent industry analyst Jerry Laiserin and a white paper published by Autodesk, the term BIM achieved its worldwide breakthrough. Technologies that individual vendors had until then marketed under different names, such as "Virtual Building," were brought together under the common language of BIM. (Borkowski, 2023; C. Eastman et al., 2008)
Publication of the BIM maturity model: In the UK, the BIM maturity model (the Bew-Richards ramp) was proposed, clearly defining staged levels of BIM adoption (Level 0 through Level 3). The model became a key reference for governments drafting BIM promotion policies and a yardstick by which companies could measure their own BIM maturity. (Borkowski, 2023; Borrmann et al., 2018)
The 2010s onward: National mandates and the evolution of open standards
BIM mandates around the world: The UK government announced its BIM strategy in 2011 and, from 2016, made "Level 2 BIM" mandatory for all publicly procured projects. Elsewhere, Singapore (CORENET), the United States (GSA), Finland and other Nordic countries, and South Korea, among others, have strongly promoted or mandated the use of BIM and the IFC format on public projects. (Borkowski, 2023; Borrmann et al., 2018; Sacks et al., 2018)
The spread of openBIM: Led by companies such as Graphisoft and Tekla, the openBIM initiative gained real momentum. This marked a shift away from closed BIM, where users are locked into a specific vendor's software, toward an approach, now widely adopted, in which best-of-breed tools connect seamlessly through open standard formats such as IFC. (Borkowski, 2023; Hız et al., 2023)
The Data Architecture of CAD
The philosophy behind a CAD system reveals itself in how its data is designed and structured. This section takes a closer look at CAD data architecture.
How DXF Works
For exchanging CAD data, the de facto standard used around the world is DXF (Drawing Interchange Format). Developed by Autodesk for AutoCAD, DXF was designed so that the full contents of AutoCAD's proprietary internal data structure (DWG) could be read and written by other systems. To that end, it uses a human-readable ASCII text format (the most basic and universally shared character encoding standard, representing 128 characters as 7-bit values), and it went on to gain broad adoption across the industry. (Autodesk, 1993)
Describing data with group codes: The most distinctive feature of a DXF file is its data description scheme, known as group codes. Data in the file is never arranged arbitrarily; it always comes in two-line pairs consisting of a group code (a positive integer) followed by its value. The format is designed so that when a program reads a DXF file, it can determine precisely the data type and meaning of the value on the second line simply by looking at the group code on the first. Specifically, codes 0–9 denote strings, codes 10–59 denote floating-point numbers such as X coordinates or scale factors, and codes 60–79 denote integers. Code 0 is special: it serves as a marker declaring the start of a section or an entity (a graphical object). (Autodesk, 1993)
The hierarchical structure of the file: To keep the text data from ballooning into an unstructured mass, the file as a whole is divided into logical "sections," each beginning with a "0" followed by "SECTION" and ending with a "0" followed by "ENDSEC." There are four main sections. (Autodesk, 1993)
HEADER section: Stores system variables such as the drawing's version information ($ACADVER) and its extents ($EXTMIN, $EXTMAX), each preceded by group code "9," which indicates a variable name.
TABLES section: Holds lists of named settings that are used repeatedly throughout the drawing, such as linetypes, layers, and text styles. At the start of each table, the maximum number of entries is declared so that the reading program can allocate memory efficiently.
BLOCKS section: Stores the definitions of "blocks," groups of multiple objects bundled into a single unit. These serve as the source data for reusing the same set of shapes throughout the drawing, and can also record information such as paths to externally referenced files.
ENTITIES section: Describes the actual geometric data that is drawn on screen: lines, circles, text, and so on. The file closes with a final marker consisting of "0" followed by "EOF" (End of File).
Storing geometry data: The ENTITIES section holds the coordinates and properties of objects such as lines (LINE) and circles (CIRCLE), but it incorporates optimizations to keep the text file from growing too large. For example, if a property such as an object's color or linetype matches its default value, such as "BYLAYER" (inherit from the layer settings), that data is not written to the file at all; the entry is simply omitted. When data is missing, the reading program is designed to automatically fill in the default value. There are also constraints on how strings are represented: long text data (such as MTEXT) is split and stored in chunks of 255 characters. (Autodesk, 1993)
Lightweight representation of 3D space: DXF also applies its own compression concept when storing geometry in 3D space. Rather than recording every absolute 3D coordinate in the World Coordinate System (WCS) as-is, it stores data relative to a local 2D plane called the Entity Coordinate System (ECS). Planar objects such as circles and text, for instance, are recorded as 2D coordinates (X, Y) on the ECS plane on which they lie, plus an elevation relative to the WCS. To indicate how that plane is oriented in 3D space, only one additional piece of information is recorded: the "extrusion vector" along the Z axis. The reading program then uses a mathematical rule called the Arbitrary Axis Algorithm to derive consistent X and Y axes from this Z-axis vector, precisely reconstructing the object's original orientation in 3D space. This dramatically reduces the volume of data. (Autodesk, 1993)
Attaching external data: DXF does more than store geometry. It also provides a flexible mechanism called Extended Entity Data (XDATA), which lets third-party software attach its own non-geometric data (such as attribute information) to objects. XDATA uses a special range of group codes in the 1000s (for example, 1000 for strings and 1040 for real numbers), and, prefixed by a registered application name, allows custom information to be embedded directly within an object. (Autodesk, 1993)
Faster reading and writing: As an ASCII text format, DXF offers human-readable transparency, but it can also suffer from large file sizes, floating-point rounding errors, and slow load times. To address this, Autodesk also provides a "binary DXF" format. It retains the same data structure as the ASCII version (the group code scheme) but writes the data directly as binary values (such as IEEE double-precision floating-point numbers). This preserves full data precision while cutting file size by roughly 25% and speeding up reading and writing by roughly fivefold. (Autodesk, 1993)
Sample Code
A sample of group codes
Here is an example to illustrate group codes. Think of the DXF format as an application form submitted to a government office.
—
Suppose the form is filled in like this:
Field 1 (Name): Taro Yamada
Field 2 (Date of birth): January 1, 1990
Field 3 (Address): Chiyoda-ku, Tokyo...
—
If you write this out as alternating lines of field number and content, you get the following:
—
1
Taro Yamada
2
January 1, 1990
3
Chiyoda-ku, Tokyo...
The first line is the number, and the second line is the content for that number. This is the basic structure of DXF's group-code approach.
—
In a DXF file, what corresponds to the field number on the form is called the group code, and what corresponds to the content is called the value.
—
0 ← group code (indicates the type of entity, i.e., element)
LINE ← value (meaning "this is a line")
8 ← group code (indicates the layer)
0 ← value (the layer name is "0")
10 ← group code (X coordinate of the start point)
0.0 ← value (X = 0.0)
20 ← group code (Y coordinate of the start point)
0.0 ← value (Y = 0.0)
11 ← group code (X coordinate of the end point)
100.0 ← value (X = 100.0)
21 ← group code (Y coordinate of the end point)
0.0 ← value (Y = 0.0)
—
Taken together, this information says: a single line was drawn from (0,0) to (100,0).
A sample of the file's overall hierarchy
Here is an example of how the entire file is structured. A file that stores a CAD drawing (a DXF) is something like a filing cabinet with five drawers.
┌─────────────────────────┐
│ ▼ DXF file (the cabinet)
│
│ ┌─ SECTION ─┐
│ │ HEADER │ ← basic information about the drawing as a whole
│ └───ENDSEC──┘
│
│ ┌─ SECTION ─┐
│ │ TABLES │ ← registry of frequently used settings
│ └───ENDSEC──┘
│
│ ┌─ SECTION ─┐
│ │ BLOCKS │ ← registry of reusable components
│ └───ENDSEC──┘
│
│ ┌─ SECTION ─┐
│ │ ENTITIES │ ← the shapes actually drawn
│ └───ENDSEC──┘
│
│ EOF ← closes the cabinet
└─────────────────────────┘
Each drawer has a name. At the start of a drawer you find "0 SECTION" (opening this drawer now), and at the end "0 ENDSEC" (closing this drawer).
A HEADER sample
This section holds metadata for the file as a whole. It is not the content of the drawing itself, but rather a description of what kind of drawing this is. A familiar analogy is the cover of a book, which tells you things like:
Author
Publisher
Year of publication
The DXF HEADER contains items such as:
The AutoCAD version ($ACADVER)
The display extents of the drawing ($EXTMIN, $EXTMAX)
Units (mm / m / inch, etc.)
The current layer settings
A real-world sample looks like this:
—
0
SECTION
2
HEADER
9
$ACADVER ← variable name "AutoCAD version"
1
AC1027 ← value "2013 release"
9
$EXTMIN ← variable name "lower-left corner of the drawing"
10
0.0 ← X coordinate
20
0.0 ← Y coordinate
9
$EXTMAX ← variable name "upper-right corner of the drawing"
10
1000.0
20
500.0
0
ENDSEC
—
Group code 9, which appears here for the first time, indicates a variable name (a system variable).
TABLES: a registry of frequently used settings
This is where named settings that get used over and over are registered. A familiar analogy is a company phone directory:
Sales Department, A: extension 100
Accounting Department, B: extension 200
When the body of a document needs to say "contact A," it would be tedious to write out "A (Sales Department, Tokyo head office, joined in 1990...)" every single time. So the name and its details are registered in advance. That is the role of TABLES.
The DXF TABLES section includes:
Layer table: the mapping of layer names to colors and linetypes
Linetype table: pattern definitions such as "dashed" and "dash-dot"
Text style table: fonts and sizes
Dimension style table
All of these are recorded here.
A real-world sample (excerpting only the layer table) looks like this:
—
0
SECTION
2
TABLES
0
TABLE
2
LAYER ← start of the layer table
70
3 ← there are three layers (declaration of the maximum count)
0
LAYER
2
0 ← layer name "0"
62
7 ← color number 7 (white)
6
CONTINUOUS ← linetype "solid"
0
LAYER
2
Wall ← layer name "Wall"
62
1 ← color number 1 (red)
6
CONTINUOUS
0
LAYER
2
Door ← layer name "Door"
62
3 ← color number 3 (green)
6
CONTINUOUS
0
ENDTAB ← end of the layer table
0
ENDSEC
—
A BLOCKS sample
This is where components made up of multiple shapes are registered. A familiar analogy is a box of LEGO pieces, holding things like:
A window unit (frame + mullions + label as a set)
A door unit (frame + leaf + handle as a set)
A title block (the box in the lower right of a drawing showing the drawing name, scale, and date)
Once these are registered as components, they can be reused as many times as needed throughout the drawing. When you need to draw doors in 100 places, you don't draw the door shape from scratch each time; you simply specify "place a door unit here."
—
A real-world sample:
0
SECTION
2
BLOCKS
0
BLOCK
2
DoorUnit ← block name "DoorUnit"
10
0.0 ← the block's base point (X)
20
0.0 ← base point (Y)
0
LINE ← line 1 making up this block
8
0
10
0.0
20
0.0
11
800.0
21
0.0
0
LINE ← line 2 making up this block
8
0
10
0.0
20
0.0
11
0.0
21
2100.0
0
ENDBLK ← end of block "DoorUnit"
0
ENDSEC
—
Then, in the body of the drawing (ENTITIES), you write this:
—
0
INSERT ← insert a block
2
DoorUnit ← call up "DoorUnit"
10
1000.0 ← placement position X
20
0.0 ← placement position Y
—
That alone is enough to draw a door at that position.
Sample of the ENTITIES section
This is the main drawer. It holds the lines, circles, text and other objects actually drawn on screen. In everyday terms, it corresponds to the body text of a personal statement. ENTITIES is the star of the file.
A real-world sample
—
0
SECTION
2
ENTITIES
0
LINE ← first line
8
Wall
10
0.0
20
0.0
11
1000.0
21
0.0
0
LINE ← second line
8
Wall
10
0.0
20
0.0
11
0.0
21
500.0
0
CIRCLE ← circle
8
Door
10
500.0
20
250.0
40
50.0
0
INSERT ← calls up and places "DoorUnit"
2
DoorUnit
10
800.0
20
0.0
0
TEXT ← text
8
Annotation
10
500.0
20
600.0
40
20.0
1
LIVING ROOM
0
ENDSEC
—
What this describes is a drawing with two walls, one circle representing a door, one door component, and one text label reading LIVING ROOM. The content written here is exactly what you see on the CAD screen: the lines, circles, text and so on.
Sample of the EOF (End of File) marker
Finally, there is a marker signaling the end of the file.
—
0
EOF
—
If a file lacks this marker, the CAD software concludes that the file has been cut off partway through and throws an error. It is the equivalent of the final page of a book that says "The End."
From drawing in CAD to saving as DXF: how the process works
In CAD, the journey from drawing a set of drawings to saving them as DXF (Drawing Interchange Format), a format that allows data exchange between different systems, consists of a chain of precise calculations and data transformations.
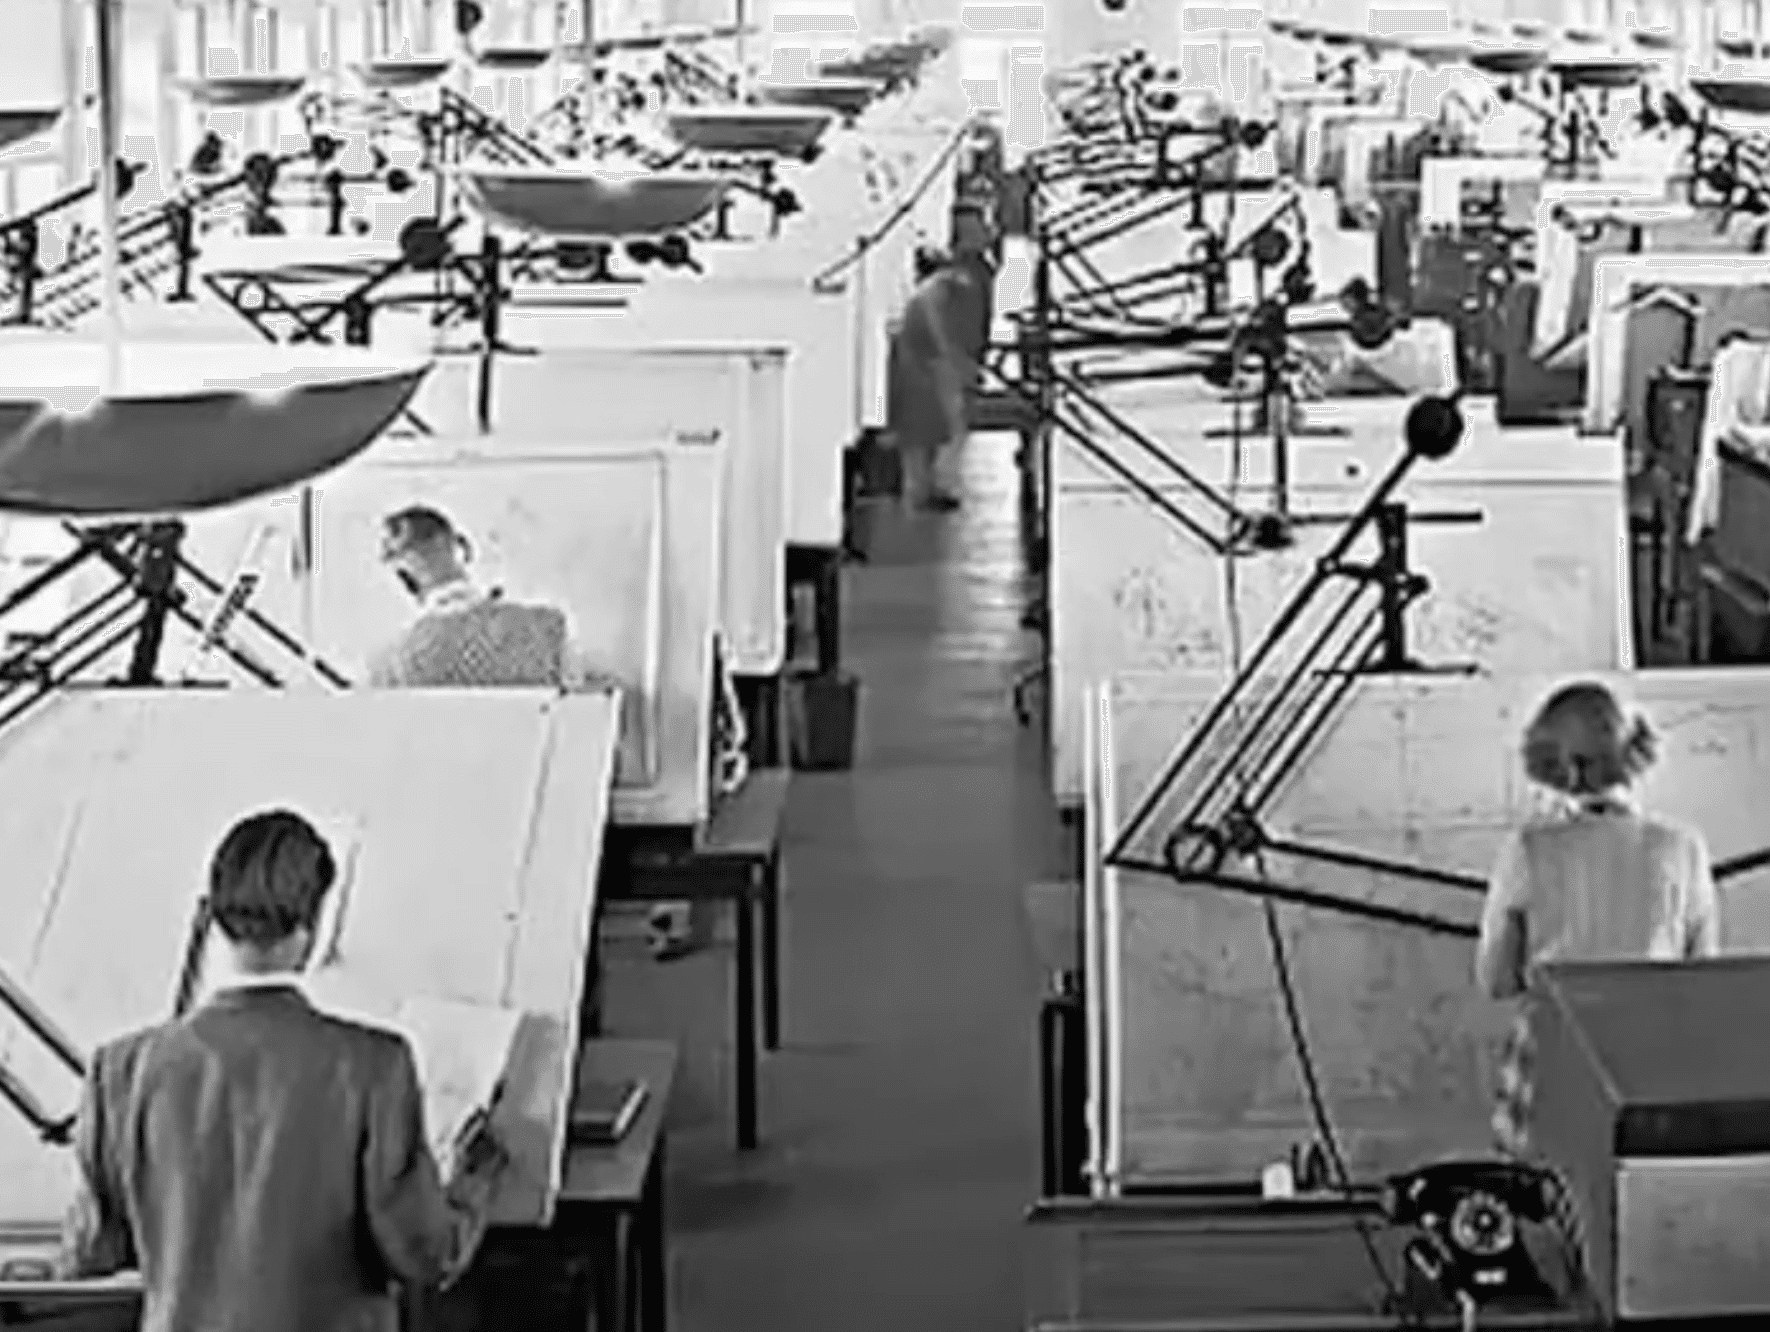
Placing geometric shapes (the drafting process): On the electronic drafting board that is CAD, the designer creates drawings by combining geometric primitives such as line segments, arcs and text. Unlike BIM, the CAD system itself has no understanding of semantic information such as "this line is a wall"; it simply processes the drawing as a collection of pure graphic elements (lines and text). (Ball, 2013; C. M. Eastman, 1989)
Logical division of the file into sections: When saving (exporting) to DXF begins, the data is not written out haphazardly. Instead, it is strictly divided into logical sections such as HEADER (system variables), TABLES (layer and linetype settings), BLOCKS (reusable groups of shapes) and ENTITIES (the actual drawing objects), and output to a text file. (Autodesk, 1993)
Serializing data using group codes: Every piece of data written to the file is serialized as a two-line pair consisting of a group code (a positive integer) and its value. Rules such as "code 10 is followed by an X coordinate" and "code 8 is followed by a layer name" allow other programs to correctly interpret the data type and meaning of each value when reading the text data. (Autodesk, 1993)
Optimizing data by omitting default values: Because ASCII text tends to bloat, automatic optimization is performed on output. When properties such as an object's color or linetype match a default value such as BYLAYER (inherit the layer's setting), the entry is simply omitted from the file, keeping the file size down. (Autodesk, 1993)
Lightweight spatial representation using ECS: When saving objects in 3D space, rather than recording every absolute coordinate, the file records only coordinates on a local 2D plane called the Entity Coordinate System (ECS) together with a Z-axis extrusion vector. On loading, the Arbitrary Axis Algorithm is used to mathematically reconstruct the original 3D orientation, dramatically reducing the volume of data. (Autodesk, 1993)
In this way, saving from CAD to DXF is a finely tuned process that optimizes the drawn geometric data using mechanisms such as proprietary group codes and ECS, and converts it into standardized text data that external programs can read.
The data architecture of BIM
The philosophy behind BIM is reflected in its data design principles and structure. This section takes a closer look at that data architecture.
How IFC works
IFC (Industry Foundation Classes) is a vendor-neutral open format for BIM data exchange, developed by buildingSMART and standardized internationally as ISO 16739. Whereas conventional CAD data was essentially a collection of geometric shape information, IFC is designed as an object-oriented data model capable of comprehensively describing the semantics, geometry and complex inter-object relationships of buildings and infrastructure.
Object-oriented data definition in the EXPRESS language: The IFC data schema (the definition of its data structure) is written in EXPRESS, a data modeling language specified in ISO 10303 (the STEP standard). EXPRESS incorporates object-oriented concepts and allows classes (entities), attributes and inheritance relationships to be rigorously defined. A graphical notation called EXPRESS-G is also used to represent the IFC schema visually. (Ball, 2013; Borrmann et al., 2018)
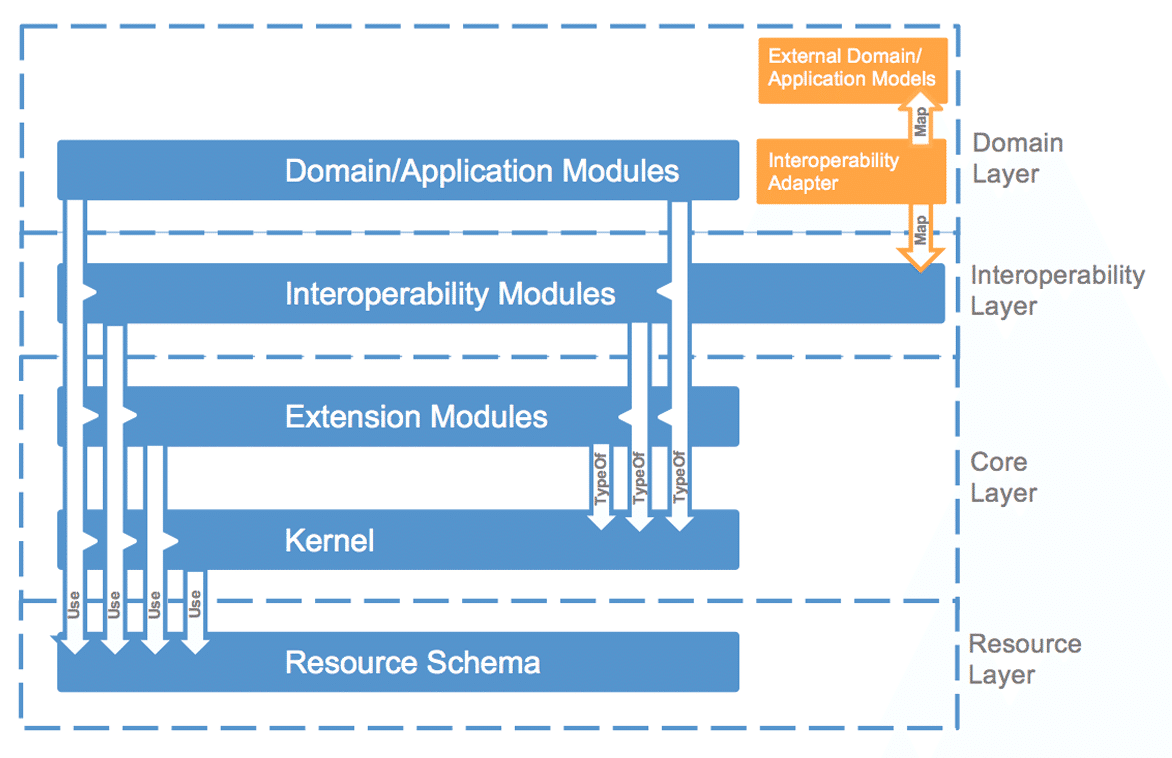
A strict four-layer schema architecture: To manage the vast and complex information of construction projects efficiently while preserving room for future extension, the IFC schema is divided into four layers governed by strict dependency rules (references are permitted only from upper layers to lower ones). (Borrmann et al., 2018)
Resource Layer: The lowest layer, providing fundamental data structures for geometric representation, topology, materials, quantities and more. Data in this layer has no independent identifiers of its own and exists only by being referenced from objects in higher layers.
Core Layer: The layer that forms the backbone of the data model. It contains abstract classes such as IfcRoot and IfcObject, the root of every physical and conceptual element, and holds metadata such as each element's globally unique identifier (GUID) and change history.
Shared/Interoperability Layer: Defines general-purpose elements used across multiple disciplines, such as architecture and building services, for example "wall (IfcWall)" and "slab."
Domain Layer: The topmost layer, defining highly specialized classes specific to particular fields such as architecture, structural analysis and HVAC.
Complete separation of semantics and geometry: One of the core features of how IFC stores data is the complete separation of an object's semantic definition from its geometric representation. For example, the semantic information that an object "is a wall" is defined independently of its shape data. This makes it possible to attach multiple geometric representations for different purposes to a single semantic wall object at the same time: a detailed 3D solid model for BIM authoring tools, a simplified surface model for energy analysis, or a 2D symbol for floor plans. (Borrmann et al., 2018)
Objectified Relationships: The most innovative aspect of IFC is its "objectification of relationships." Rather than linking elements directly via attribute pointers, IFC defines and stores each relationship as an independent object (a subclass of IfcRelationship). For example, the fact that "a window is built into a wall" is recorded not as a direct link between wall and window, but through a separate relationship entity, IfcRelFillsElement, meaning "fills an opening." Likewise, a spatial hierarchy such as "a building aggregates several storeys" is recorded as IfcRelAggregates, which denotes an aggregation relationship. This allows the logical reason why elements are related to be stored explicitly within the model. (Borrmann et al., 2018)
Dynamic extensibility through Property Sets: If every one of the countless attribute requirements that vary by region and project (specific fire-resistance ratings, manufacturer information and so on) were built into the standard schema, the data model would balloon in size. To prevent this, IFC uses a mechanism called property sets. Custom groups of attributes are defined as an IfcPropertySet and then dynamically assigned to the target element after the fact via a relationship object (IfcRelDefinesByProperties). This mechanism makes it possible to add metadata flexibly without changing the schema itself. (Borrmann et al., 2018)
Physical storage formats: STEP physical files and ifcXML. When IFC data that has been assembled in memory is written out as an actual file, the most common format by far is an ASCII text file (with the .ifc extension) based on STEP clear-text encoding (ISO 10303-21). Such a file is divided into a HEADER section and a DATA section. Within the DATA section, each piece of data occupies one line, and every line is given a unique instance ID such as "#123". Objects in the file reference one another using these IDs as pointers, which allows a complex data network to be reconstructed on top of a flat text file. To make integration with web services and similar systems easier, data can also be stored and exchanged in the XML-based "ifcXML" format. (Borrmann et al., 2018)
Purpose-specific data extraction with MVDs (Model View Definitions). In real-world data exchange, passing around every last piece of information in an enormous IFC model is inefficient. Instead, the business requirements—who needs which information, and when—are first defined in an IDM (Information Delivery Manual). This is then translated into an MVD: a technically implementable subset of IFC that effectively acts as a set of filtering conditions for the information. By exporting and storing data selectively in accordance with a specific MVD (such as the Coordination View), software keeps file sizes from ballooning while ensuring a reliable exchange that contains exactly what is needed—no more, no less. (Borrmann et al., 2018)
Sample code
If a CAD file (DXF) is a picture that depicts what a building looks like, IFC is the building's family register and relationship chart.
DXF: there is a line here, and another line over there
IFC: there is an individual called a "wall" here and a "window" somewhere else, and the two are linked by an "is embedded in" relationship
A family register records relationships: who is whose parent or child, who is married to whom, where everyone lives. IFC works the same way, expressing the relationships between the components that make up a building. With that in mind, let's walk through some sample code.
A sample of object-oriented definitions in the EXPRESS language
This works much like the way people are classified at a school.
—
Human (base class)
├─ Student (inherits from Human, adds a student ID number)
│ ├─ Elementary school student (inherits from Student, adds a school backpack attribute)
│ └─ High school student (inherits from Student, adds a cycles-to-school attribute)
└─ Teacher (inherits from Human, adds a subject attribute)
—
Here, an "elementary school student" has every characteristic of a "student," plus some characteristics of its own.
Written in IFC, the same idea looks like this.
—
IfcRoot (the root of everything; carries a GUID and history)
├─ IfcObjectDefinition
│ └─ IfcObject
│ └─ IfcProduct (has a position and a shape)
│ ├─ IfcElement (physical building elements)
│ │ ├─ IfcWall (wall)
│ │ ├─ IfcSlab (floor slab)
│ │ ├─ IfcColumn (column)
│ │ └─ IfcWindow (window)
│ └─ IfcSpatialElement (spatial elements)
│ ├─ IfcSite (site)
│ ├─ IfcBuilding (building)
│ └─ IfcBuildingStorey (storey)
—
A "wall" (IfcWall) has every characteristic of a "physical building element" (IfcElement), with wall-specific attributes added on top.
The actual IFC schema (simplified) looks like this.
—
ENTITY IfcWall
SUBTYPE OF (IfcBuildingElement);
PredefinedType : OPTIONAL IfcWallTypeEnum;
END_ENTITY;
—
This says: "IfcWall inherits from IfcBuildingElement and additionally has an attribute called PredefinedType."
The four-layer architecture
The IFC schema is structured like a four-storey building, with a rule that references may only flow from top to bottom. Think of it as a company's organizational chart.
—
[Top] Domain layer (architecture-specific, structure-specific, building-services-specific)
↓ may reference
[Middle] Shared layer (common building elements such as walls and floors)
↓ may reference
[Middle] Core layer (abstract classes such as IfcRoot and IfcObject)
↓ may reference
[Bottom] Resource layer (component-level data such as coordinates, materials and quantities)
—
The rule: upper layers may use lower layers, but lower layers know nothing about the layers above them. This resembles a healthy organizational design in which specialist departments can draw on the services of shared departments, while the shared departments never need to know the specifics of any particular specialist's work.
・The domain layer (specialized for a particular discipline) looks like this.
—
# IfcSensor (sensor) is used in the building services domain (HVAC, BMS)
sensor = IfcSensor(global_id=\"xyz789\", name=\"TempSensor1\")
—
・The shared layer (elements used across multiple disciplines) looks like this.
—
# IfcWall (wall) is used in architecture, structure and building services alike
wall = IfcWall(global_id=\"abc123\", name=\"W1\")
—
・The core layer (abstract objects that inherit from IfcRoot) looks like this.
—
# IfcRoot is the ancestor of every element
class IfcRoot:
GlobalId # GUID (unique ID)
OwnerHistory # who created it, and when
Name # name
Description # description
—
・The resource layer (the bottom layer: component-level data with no IDs) looks like this.
—
# IfcCartesianPoint (coordinates)
point = IfcCartesianPoint(coordinates=[0.0, 0.0, 0.0])
# IfcMaterial (material)
material = IfcMaterial(name=\"Concrete\")
—
Separating meaning (semantics) from shape (geometry)
In IFC, the meaning—"this is a wall"—and the shape—"the wall is a rectangle like this"—are recorded separately. It's a bit like introducing a person.
Picture a person, Ms. A, who has several photographs attached to her, each for a different purpose.
Photo A: a straight-on portrait for her résumé
Photo B: a white-background shot for her passport
Photo C: a natural smile for her social media avatar
IFC works the same way. A single semantic entity—"this is a wall"—can have multiple shapes attached to it, one for each purpose.
# First, create the semantic entity: "this is a wall"
wall = IfcWall(
global_id=\"abc123\",
name=\"LivingRoomWall_W1\"
)
# Next, attach various shapes to that wall
# Shape 1: a detailed 3D solid (for BIM viewers)
representation_3d = IfcShapeRepresentation(
type=\"SweptSolid\",
items=[detailed_solid_geometry]
)
# Shape 2: a simplified surface (for energy analysis)
representation_simple = IfcShapeRepresentation(
type=\"Surface\",
items=[simple_surface]
)
# Shape 3: a floor-plan symbol (for 2D drawings)
representation_2d = IfcShapeRepresentation(
type=\"Annotation2D\",
items=[wall_symbol]
)
# Attach all three representations to the single wall
wall.Representation = IfcProductDefinitionShape(
representations=[representation_3d, representation_simple, representation_2d]
)
This enables the following kinds of use.
The BIM viewer displays the "3D solid"
The energy analysis software runs its calculations on the "simplified surface"
The drawing output tool uses the "2D symbol" to produce the floor plan
Because all of these derive from the same wall, moving the wall keeps every representation in sync.
Relationships as objects
A relationship such as "B is inside A" is not recorded by linking A and B directly; instead, the relationship itself is recorded as an independent entity. This is similar to how a marriage is recorded.
Marriage
├─ Party A
├─ Party B
├─ Date of marriage: October 10, 2020
└─ Place of marriage: XXX city
Written in IFC, the relationship "there is a window in the wall" looks like this.
• Describe the wall, window, and opening
pythonwall = IfcWall(global_id="wall001", name="W1")
window = IfcWindow(global_id="win001", name="WIN1")
opening = IfcOpeningElement(global_id="op001", name="OP1")
• The relationship "the wall has an opening"
pythonrel_voids = IfcRelVoidsElement(
global_id="rel001",
relating_building_element=wall, # the element with the opening = the wall
related_opening_element=opening # that opening = OP1
)
• The relationship "the window sits in the opening"
pythonrel_fills = IfcRelFillsElement(
global_id="rel002",
relating_opening_element=opening, # the opening being filled = OP1
related_building_element=window # the element filling the opening = WIN1
)
With this, the chain "wall → opening → window" is recorded through three relationship objects.
Modeling relationships as objects brings several advantages:
Attributes can be attached to the relationship itself (e.g., "when was this relationship added?" or "who approved it?")
The reasoning behind a relationship can be preserved ("this wall and this beam are connected for structural reasons")
Relationships can be queried later ("retrieve every relationship involving this wall")
Dynamic extension through property sets
The attributes a project needs vary endlessly by region and use. Baking all of them into the schema would bloat it, so IFC provides a mechanism for freely adding attributes after the fact. It works much like a smartphone app store.
The device (the schema): ships with standard functionality only
The apps (property sets): added as needed
Each user installs only the apps they need
If every feature were built into the device from the start, the device itself would become bloated.
A standard IfcWall carries the following attributes:
pythonwall = IfcWall(
global_id="wall001",
name="W1",
description="Living room south wall"
)
When you want to attach additional attributes, you create a property set. For example, adding attributes describing the wall's performance looks like this:
—
fire_props = IfcPropertySet(
global_id="ps001",
name="Pset_WallCommon",
has_properties=[
IfcPropertySingleValue(name="FireRating", value="1H"),
IfcPropertySingleValue(name="ThermalTransmittance", value=0.35),
IfcPropertySingleValue(name="AcousticRating", value="D-45")
]
)
—
A relationship object then links the property set to the wall:
—
rel_defines = IfcRelDefinesByProperties(
global_id="rel003",
related_objects=[wall], # the target wall
relating_property_definition=fire_props # the property set to attach
)
—
The wall now carries the information "one-hour fire rating, thermal transmittance 0.35, acoustic rating D-45", all added after the fact.
This approach offers the following benefits:
Attributes can be added without modifying the core schema
Country-, region-, and project-specific requirements can be accommodated
The same property set can be shared across multiple elements
buildingSMART has defined a large number of standard property sets (Pset_*), so a shared industry-wide vocabulary is taking shape
Physical file formats (.ifc / ifcXML)
In-memory IFC data is saved as a text file in the STEP physical file format. (STEP, the STandard for the Exchange of Product model data (ISO 10303), is an international standard intermediate file format designed to transfer geometry data accurately between different 3D CAD applications.) Entities reference one another through IDs such as #1 and #2.
A real .ifc file looks like this (simplified):
—
ISO-10303-21;
HEADER;
FILE_DESCRIPTION(('ViewDefinition [CoordinationView]'),'2;1');
FILE_NAME('example.ifc','2025-05-05T10:00:00',('Author'),('Org'),'IFC4','Software','');
FILE_SCHEMA(('IFC4'));
ENDSEC;
DATA;
#1=IFCPROJECT('0YvctVUKr0kugbFTf53O9L',$,'ExampleProject',$,$,'ExampleProject',$,(#10),#5);
#2=IFCSITE('1xS3BCk291UvhgP2dvNMKI',$,'Site',$,$,#15,$,$,.ELEMENT.,$,$,$,$,$);
#3=IFCBUILDING('2YeQrjMKTBLRrCu0v9wTAF',$,'Building',$,$,#20,$,$,.ELEMENT.,$,$,$);
#4=IFCBUILDINGSTOREY('1aAabcDeFgHiJkLmNoPqRs',$,'Level 1',$,$,#25,$,$,.ELEMENT.,0.);
#10=IFCWALL('3xYzAbcDe1234567890fGh',$,'W1','LivingRoomWall',$,#30,#40,$,.STANDARD.);
#11=IFCWINDOW('4xYzAbcDe1234567890fGh',$,'WIN1','LivingRoomWindow',$,#31,#41,$,1.5,1.0,.WINDOW.);
#50=IFCRELCONTAINEDINSPATIALSTRUCTURE('5relA12345',$,$,$,(#10,#11),#4);
#60=IFCRELVOIDSELEMENT('6relB12345',$,$,$,#10,#70);
#70=IFCOPENINGELEMENT('7opA12345',$,'OP1',$,$,#32,#42,$,.OPENING.);
#80=IFCRELFILLSELEMENT('8relC12345',$,$,$,#70,#11);
ENDSEC;
END-ISO-10303-21;
—
How to read it
#1=IFCPROJECT(...) → ID #1 is the project
#2=IFCSITE(...) → ID #2 is the site
#10=IFCWALL(...) → ID #10 is wall W1
#11=IFCWINDOW(...) → ID #11 is window WIN1
#50=IFCRELCONTAINEDINSPATIALSTRUCTURE(...,(#10,#11),#4) → the relationship "elements #10 and #11 are contained in #4 (Level 1)"
#60=IFCRELVOIDSELEMENT(...,#10,#70) → the relationship "#10 (the wall) has opening #70 cut into it"
#80=IFCRELFILLSELEMENT(...,#70,#11) → the relationship "#70 (the opening) is filled by #11 (the window)"
Every element is laid out as a flat line, and they reference one another by ID. This is how the file expresses a network structure—one in which the architectural, structural, and MEP data are not isolated silos, but where elements such as walls, columns, and pipes carry attributes (size, material, cost, and so on) and are interlinked with each other.
Use-specific data extraction with MVDs (Model View Definitions)
Because IFC files contain an enormous amount of information, there is a mechanism—the MVD—for extracting only the portion needed for a given purpose. It's a bit like the difference between a resume and a detailed career history.
Resume: basic details plus an overview of education and employment (for the HR department)
Career history: project details, technology stack, and quantified achievements (for the technical interviewer)
My Number registration form: legally required personal identification details (for government agencies)
In other words, it's all information about the same "you", but the set of information you hand over differs depending on the recipient.
IFC defines several standard MVDs. The most commonly used are listed below.
—
CoordinationView 2.0
Purpose: coordination and clash detection between designers
Includes: geometry, spatial structure, element relationships
Excludes: detailed parameters, fabrication information
ReferenceView
Purpose: viewing for reference (lightweight)
Includes: simplified geometry, identification information
Excludes: detailed properties
DesignTransferView
Purpose: bidirectional exchange of design data
Includes: almost everything
Excludes: very little
BasicFMHandoverView
Purpose: handover for facility management
Includes: equipment, spaces, operational information
Excludes: detailed geometry
—
In Revit's actual "Export to IFC" dialog, the options look like this:
—
[Export settings]
IFC version: [IFC4 ▼]
MVD: [Reference View ▼]
Options:
- Coordination View 2.0
- Reference View
- Design Transfer View
- Basic FM Handover
- GSA Concept Design BIM 2010
—
The contents of the generated IFC file change depending on which MVD you choose. There is a trade-off—Reference View is lightweight, while Design Transfer View carries far more information—so you can pick whichever suits the task at hand.
Bringing it all together in a single code example
The following is a minimal example that builds an IFC model incorporating every feature covered so far (using the Python ifcopenshell library).
—
pythonimport ifcopenshell
from ifcopenshell.api import run
# Create a new IFC file
model = ifcopenshell.file(schema="IFC4")
# Create the project → site → building → storey hierarchy
project = run("root.create_entity", model, ifc_class="IfcProject", name="ExampleProject")
site = run("root.create_entity", model, ifc_class="IfcSite", name="Site")
building = run("root.create_entity", model, ifc_class="IfcBuilding", name="Building")
storey = run("root.create_entity", model, ifc_class="IfcBuildingStorey", name="Level 1")
# Record the hierarchy as aggregation relationships
run("aggregate.assign_object", model, relating_object=project, product=site)
run("aggregate.assign_object", model, relating_object=site, product=building)
run("aggregate.assign_object", model, relating_object=building, product=storey)
# Create a wall
wall = run("root.create_entity", model, ifc_class="IfcWall", name="W1")
# Place the wall in the storey (the relationship itself becomes an object)
run("spatial.assign_container", model, product=wall, relating_structure=storey)
# Add properties such as fire rating to the wall
pset = run("pset.add_pset", model, product=wall, name="Pset_WallCommon")
run("pset.edit_pset", model, pset=pset, properties={
"FireRating": "1H",
"ThermalTransmittance": 0.35
})
# Save as an .ifc file
model.write("example.ifc")
—
This single snippet of code embodies every one of the characteristics described so far.
Object orientation: IfcWall inherits from IfcRoot
Four layers: IfcWall (shared layer) inherits from IfcRoot (core layer) and makes use of IfcCartesianPoint (resource layer)
Separation of semantics and geometry: the wall's meaning has been created; its shape can be added separately
Relationships as objects: aggregate.assign_object and spatial.assign_container create relationship objects behind the scenes
Property sets: pset.add_pset adds attributes dynamically
Physical file: model.write("example.ifc") saves the model in STEP format
From Drawing in BIM to Saving as IFC: How the Process Works
In BIM, the process by which drawings are created and then saved to IFC, the international data-exchange standard, bears no resemblance to "drawing lines" in conventional CAD. It rests instead on a sophisticated database-processing mechanism.
Building the integrated database and "extracting" drawings
Constructing a virtual building through parametric modeling: In a BIM environment, designers do not draw shapes on a canvas. Instead, they place intelligent objects such as "walls" and "doors," each carrying both semantic information (meaning) and geometric information (shape), into a virtual space, thereby building an integrated database of the building. (Azhar, 2011; C. M. Eastman, 1991)
Drawings generated as reports: As Eastman and colleagues point out, floor plans, sections, and elevations in BIM function as "specially formatted reports": virtual cutting planes are placed through the single 3D model, and the drawings are dynamically extracted from it. (C. M. Eastman, 1991)
Bidirectional updates and guaranteed consistency: Because a drawing is nothing more than a particular view of the model, changing any part of the 3D model automatically updates every related drawing and quantity schedule, guaranteeing complete consistency across the design information. (C. Eastman et al., 2008)
Exporting to IFC and filtering through MVDs
Defining data-exchange requirements (IDM): When a BIM model is handed over to another system, exporting all of its data would produce a bloated file. To avoid this, the concept of ISO 29481 (IDM: Information Delivery Manual) is used to define which information is needed for which business process. (Borrmann et al., 2018; Sacks et al., 2018)
Extracting information via MVDs: A Model View Definition (MVD) translates these requirements into a technical specification that software can process. Following the specified MVD, the system filters the vast BIM database and extracts only the subset of objects and attributes needed for the intended use. (Borrmann et al., 2018; Sacks et al., 2018)
Separating semantics from geometry and mapping the data structure
Conversion to an object-oriented schema: The extracted data is mapped onto IFC's rigorous data schema, which is defined in the EXPRESS language of ISO-STEP. In this step, the semantic information that an object "is a wall" and the geometric representation of "its 3D shape" are kept completely separate within the data structure and then linked to each other. Connections between elements are likewise defined independently as "relationship objects." (Borrmann et al., 2018)
Serializing (saving) to a STEP physical file
Serialization to a text file: The complex network of information assembled in memory is ultimately saved (serialized) as an ASCII text file with the .ifc extension, following the STEP clear-text encoding (ISO 10303-21). (Borrmann et al., 2018; Laakso & Kiviniemi, 2012)
Reconstructing the network through instance IDs: The file is divided broadly into a HEADER section and a DATA section. Every object written to the DATA section (physical elements, relationships, geometry data, and so on) occupies one line and receives a unique instance ID such as "#124." Because each piece of data refers to the others through pointers based on these IDs, the original complex network structure is faithfully recorded within a flat text file. (Borrmann et al., 2018)
Saving from BIM to IFC, then, is not a matter of drawing shapes and storing them. It is a highly refined data-engineering process: information is dynamically extracted from an intelligent virtual model according to its intended use, then translated and recorded as a highly structured network of objects in an internationally standardized text format.
CAD vs. BIM: A Summary of the Differences
CAD and BIM have both driven digitalization in the architecture, engineering, and construction (AEC) industry, yet they take fundamentally different approaches to two things: the process of producing drawings and the file structure used to store data.
Differences in basic concept and data structure
CAD (a collection of shapes): CAD evolved as an "electronic drafting board," transplanting the traditional drafting board into a digital environment. CAD data is represented as a collection of geometric primitives such as line segments, arcs, and surfaces, and the system itself has no understanding of the semantics involved: it does not know that a given line is a "wall" or a "pipe." (Borkowski, 2023; Borrmann et al., 2018)
BIM (an integrated database with meaning): BIM aims to build an intelligent digital virtual model that contains not only geometry but also non-geometric attributes and semantic information. The building is constructed within a single integrated database as a collection of objects that carry parameters such as dimensions, materials, and performance characteristics. (Borkowski, 2023; Borrmann et al., 2018; Deng et al., 2021; C. Eastman et al., 2008; Liu et al., 2019)
Differences in the drawing-production process
CAD (manual drafting): Designers produce drawings by explicitly placing lines and shapes one at a time on a 2D or 3D canvas. When a design change affects multiple drawings, every related drawing must be corrected individually by hand. (Borrmann et al., 2018)
BIM (extraction from the model): In a BIM environment, floor plans, sections, and other drawings are not drawn by hand. They are generated as reports dynamically extracted from a single integrated 3D model through virtual cutting planes. Change one part of the model, and every drawing and quantity schedule updates automatically, guaranteeing complete consistency of information. (Borrmann et al., 2018; C. Eastman et al., 2008)
Differences in data storage and exchange formats
CAD (DXF): DXF, the de facto standard format, is specialized for conveying geometric shapes accurately and efficiently, storing shape data in a flat list structure. (Autodesk, 1993)
BIM (IFC): IFC, the international standard, is an object-oriented data model for exchanging building information. It stores the semantic definition of each object strictly separate from its geometric representation, and it stores relationships between elements (for example, "a window sits in an opening cut into a wall") as independent data in a complex network. (Borrmann et al., 2018; Laakso & Kiviniemi, 2012)
Differences in their role within a project
CAD (drafting support tool): Used primarily as a passive tool for automating the production of drawings during the design phase and making geometric modeling work more efficient. (Ball, 2013; C. Eastman et al., 2008)
BIM (collaboration platform): Serves as an active platform that turns information into an asset across the entire building lifecycle—from design through construction, facility management (FM), and demolition—and fosters collaboration among project participants. (Borkowski, 2023; Deng et al., 2021; C. Eastman et al., 2008; Olawumi et al., 2017)
In short, CAD is a technology specialized in digitizing geometric figures and making drafting more efficient, whereas BIM is an information platform grounded in an entirely different epistemology: one that integrates a building's semantic information and relationships and manages and shares them across the whole lifecycle.
The Future of CAD and BIM
CAD and BIM developed from different lineages, and in recent years they have come to intersect in the domain of architectural design. This section looks at where CAD and BIM are heading from here.
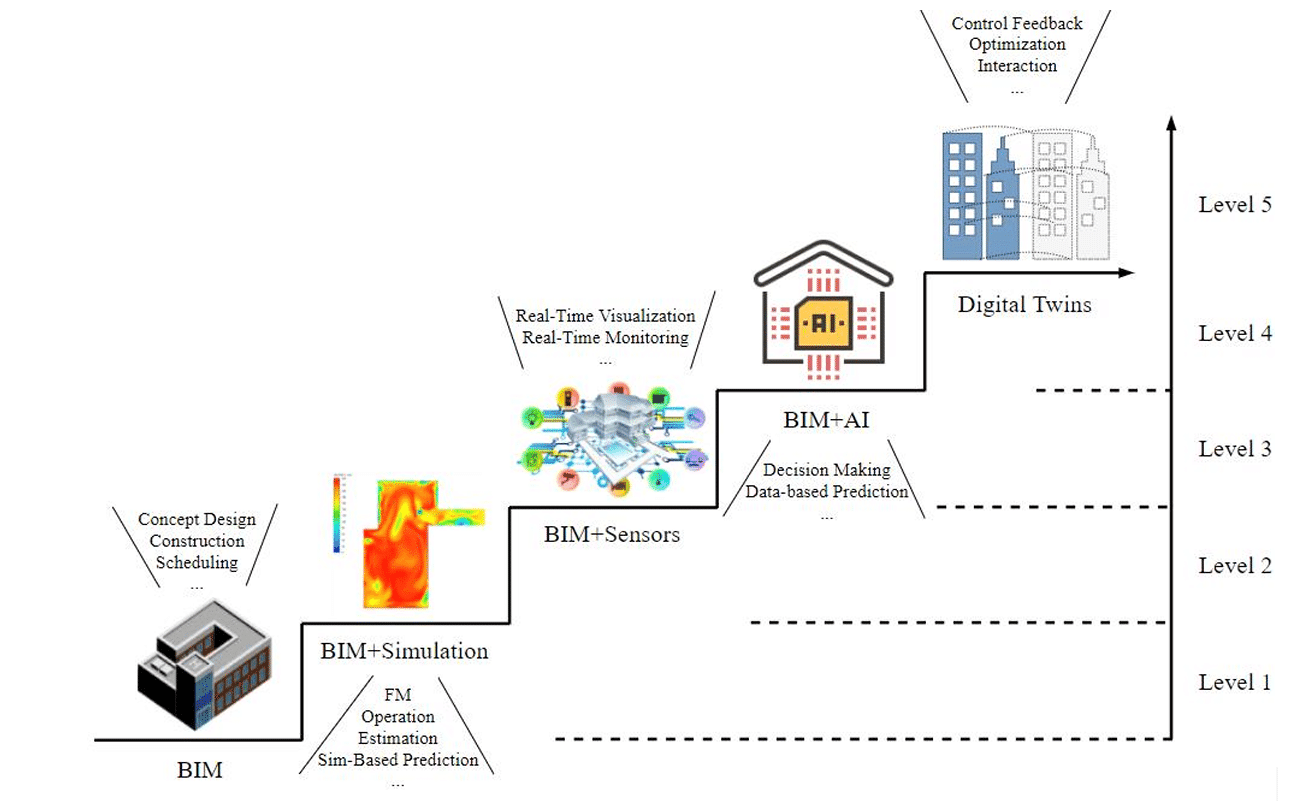
How Will CAD and BIM Evolve?
Until now, computer-aided design (CAD) and building information modeling (BIM) in the architecture, engineering, and construction (AEC) industry have evolved with one dedicated purpose: producing accurate drawings and models as efficiently as possible. Today, however, these technologies are converging with emerging fields such as artificial intelligence (AI), the Internet of Things (IoT), and extended reality (XR), and are on the verge of becoming autonomous, intelligent information platforms.
The key points are as follows.
Cloud computing and enhanced collaboration: CAD software, which traditionally depended on high-performance individual workstations, is migrating to cloud-based platforms. As hardware advances, enormous models can be processed and intensive analyses and simulations run at high speed in the cloud, making it easy for project teams around the world to access a single source of data in real time and work on it simultaneously. (Alin & Stăncioiu, 2024)
BIM subsuming CAD, and a paradigm shift: Just as CAD once replaced pencil and paper in the AEC industry, BIM is now taking over the role once played by CAD. Conventional CAD systems, which draw simple lines and surfaces (2D/3D), are being absorbed into object-based BIM environments carrying semantic information. CAD is thus expected to shift from developing as a standalone technology to serving as the geometric modeling engine within a BIM platform. (Borrmann et al., 2018; Hız et al., 2023)
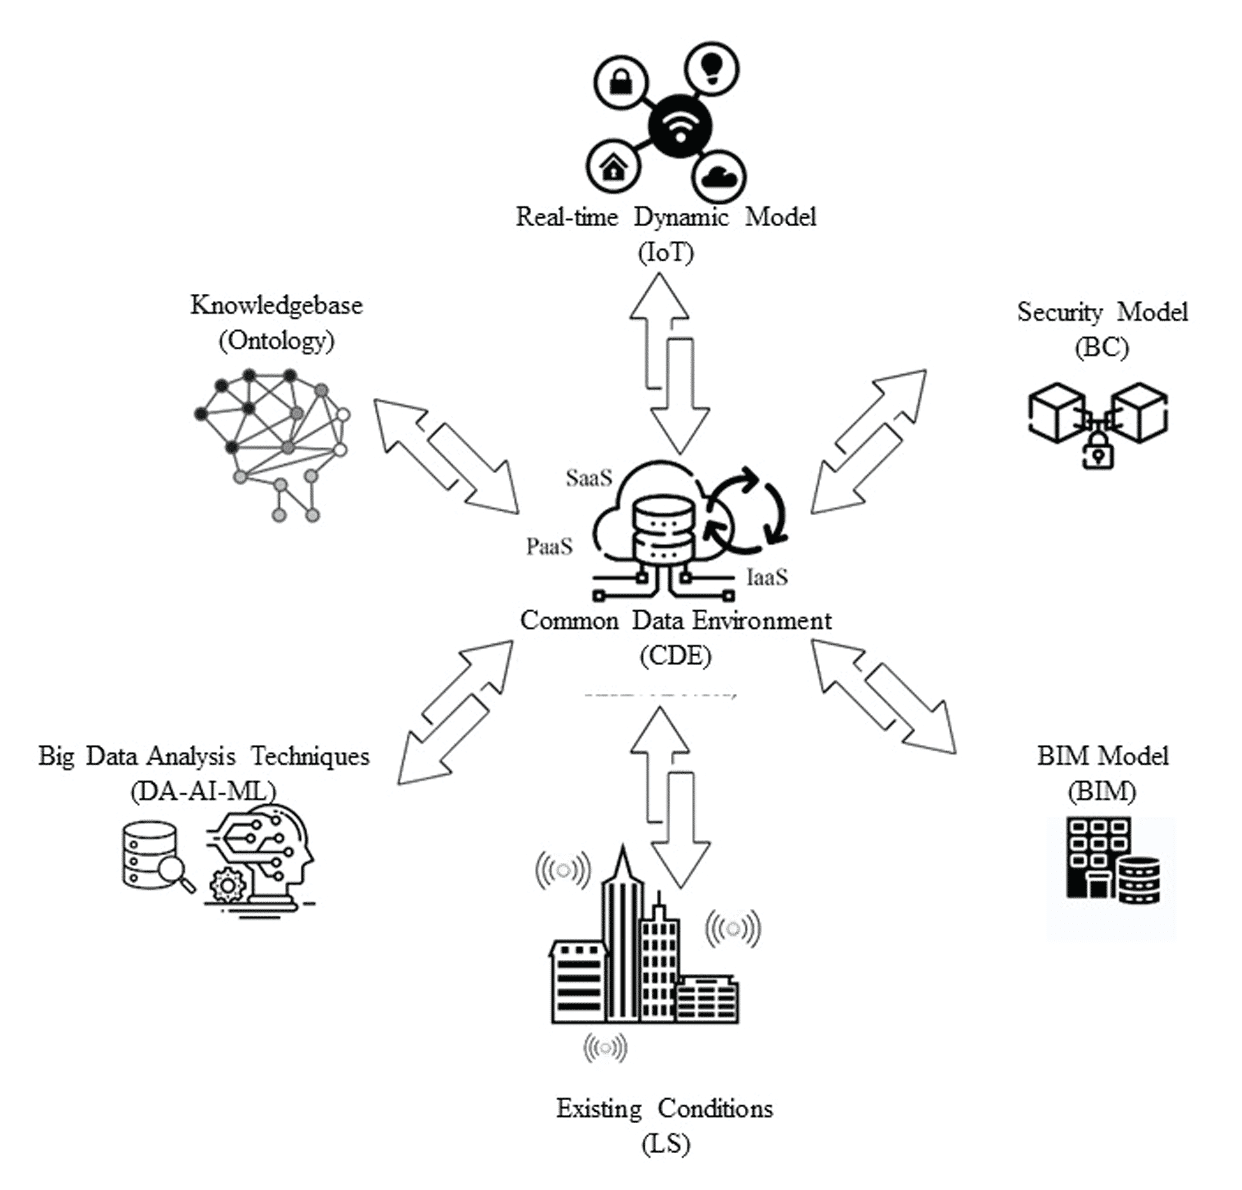
Digital twins through IoT integration: One of the most significant advances in BIM is the creation of digital twins by integrating it with IoT sensors. Sensors installed in real buildings and infrastructure facilities feed data—temperature, humidity, energy consumption, equipment operating status—back into the BIM model in real time. This transforms BIM from a merely static design database into a living model that reflects the building's condition in real time and performs autonomous maintenance and anomaly prediction. (Borrmann et al., 2018; Deng et al., 2021; Izbash & Babayev, 2024)
AI BIM and automation driven by AI and machine learning: Heading into the 2030s, BIM is projected to enter the era of "AI BIM," in which it is deeply integrated with artificial intelligence (AI) and machine learning (ML). Having learned from vast volumes of historical data, AI will be able to autonomously propose energy-efficient designs and automatically check compliance with complex building codes in real time (automated code checking). This frees designers from tedious code verification and repetitive tasks so they can focus on more creative work. (Borrmann et al., 2018; Deng et al., 2021; Sacks et al., 2018)
Collaboration with robotics and unmanned aerial vehicles (UAVs): On construction sites, BIM data will be used directly as the control foundation for robots and drones. Drones (UAVs) equipped with cameras and laser scanners will autonomously patrol the site, and by comparing the 3D point cloud data they capture against the BIM model, construction progress and quality can be evaluated automatically without human involvement. Beyond this, technologies in which construction robots and large-scale 3D printers loaded with BIM data autonomously assemble buildings on site or in factories are also advancing toward practical deployment. (Borrmann et al., 2018; Izbash & Babayev, 2024)
Building intuitive environments with XR (VR, AR, MR) technologies: BIM models will be integrated with extended reality (XR) technologies—virtual reality (VR), augmented reality (AR), and mixed reality (MR). During design, clients and designers can put on head-mounted displays to experience the building in virtual space and make decisions intuitively. On construction and maintenance sites, workers wearing AR glasses can see hidden piping routes and work procedures from the BIM model overlaid on the physical space in front of them, supporting accurate and safe construction. (Izbash & Babayev, 2024; Sacks et al., 2018)
Advanced prefabrication and modular construction: Building on the accurate, contradiction-free 3D data that BIM provides, the construction industry is rapidly shifting toward prefabrication (off-site factory production) and modular construction, approaches that bring it closer to manufacturing. When CNC (computer numerical control) machine tools are linked directly to BIM, even components with complex geometries can be mass-customized in factories with high precision (mass customization), dramatically cutting on-site work time and delivering uniform quality. (Sacks et al., 2018)
Expansion to smart cities through GIS integration: The scope of BIM is expanding beyond the frame of a single building to the urban scale. Integrating geographic information systems (GIS) with BIM enables simulations that draw on big data about surrounding infrastructure and the natural environment. BIM will thereby function as the core information foundation for "smart cities" (CIM: City Information Modeling), simulating and optimizing energy consumption and traffic flows across local communities and entire cities. (Borkowski, 2023; Borrmann et al., 2018; Deng et al., 2021)
How Do CAD and BIM Relate to AI Agents?
AI in particular deserves a closer look, so we cover it in more detail here, organized by phase: design, construction, and operations and maintenance.
Design phase
Convergence with generative AI (AIBIM): Going forward, BIM will merge with generative AI and evolve into the concept of "AIBIM" (AI-Driven BIM). A designer will simply enter their requirements, and an AI agent will use techniques such as GANs (generative adversarial networks) to automatically generate thousands of design alternatives, proposing in real time the designs best optimized for the client's needs and the surrounding environment. (Izbash & Babayev, 2024)
Automated code compliance checking and continuous compliance: By converting complex rules such as building codes into machine-readable form, AI algorithms will analyze BIM models and check them for code violations automatically and continuously. This guarantees regulation-compliant design from the earliest stages, and AI agents will be able to predict violations and autonomously propose solutions. (Izbash & Babayev, 2024)
Semantic enrichment (automatic assignment of semantic information): Using machine learning and neural networks, AI agents will take on the role of interpreting bare geometric data from CAD or point cloud data from laser scans, automatically (or semi-automatically) inferring semantic information and relationships—"this is a wall," for example—and adding them to the BIM model. (Sacks et al., 2018)
Construction phase
AI-driven machines as project participants: Construction projects have traditionally centered on collaboration among people. Going forward, machines, robots, and drones equipped with AI agents will participate as project "stakeholders" in their own right—providing insights, making decisions, and executing tasks based on BIM data. (Izbash & Babayev, 2024)
Autonomous progress and quality management: Drones equipped with computer vision will autonomously patrol construction sites and compare the data they capture directly against the BIM model, automatically generating as-built models and evaluating construction progress and quality without human intervention. (Borrmann et al., 2018; Izbash & Babayev, 2024)
Automatic optimization of construction planning: AI tools such as ALICE (Artificial Intelligence Construction Engineering) have emerged that automatically generate an enormous number of construction plans from a BIM model, accounting for different construction methods and crew sizes, with the AI identifying and proposing the optimal schedule. (Sacks et al., 2018)
Operations and maintenance phase
Autonomous building control through next-generation digital twins: At the final stage (Level 5) of digital twins that integrate BIM with IoT sensors, AI agents will not merely analyze real-world data but will automatically control building systems such as HVAC and lighting through real-time feedback based on optimization strategies. (Deng et al., 2021)
Predictive maintenance through machine learning: AI agents will learn from IoT sensor data and historical maintenance records to predict the future deterioration of equipment (MEP components) and lifecycle costs (LCC), and autonomously draw up optimal maintenance plans. (Deng et al., 2021)
AI-driven diagnostics for heritage buildings (HBIM): In Heritage BIM (HBIM), the field concerned with managing historic structures, practical applications are emerging in which AI agents analyze drone imagery and 3D models to rapidly and automatically detect and diagnose cracks, material deterioration, and structural damage in buildings. (Zhang & Zou, 2022)
Conclusion
Looking back over the history of CAD and BIM, it is clear that the two evolved from different lineages and different ways of thinking, yet they have gradually converged, and are now being integrated, around the shared challenge of linking data on buildings and civil structures. As more and more of this data is brought together, a range of possibilities is opening up for how it might connect with AI agents, which have advanced remarkably in recent years. For many companies, the prospect of automated design powered by AI agents may well be the catalyst that finally drives rapid adoption of BIM, a technology that until now has struggled to gain widespread traction.
References
Alexander, C. (1977). A pattern language: towns, buildings, construction. https://jrap.neduet.edu.pk/arch-journal/JRAP_2020(SecondIssue)/JRAP-2020(2ndIssue).pdf#page=52
Alin, S., & Stăncioiu, E. L. (2024). The evolution and impact of cad in modern industries: A comprehensive review. Fiability & Durability/Fiabilitate Si Durabilitate, 33(1). https://search.ebscohost.com/login.aspx?direct=true&profile=ehost&scope=site&authtype=crawler&jrnl=1844640X&AN=180240802&h=LyYzjst2wir3oNUfK%2BbvGNC0RDfEWIJ9hJYlcYGGKxjKf91F6BEHeQ6Mg%2BTTF7s5zzdOnldnQ%2FJbUL6JgYjYeQ%3D%3D&crl=c
Autodesk, I. (1993). DXF reference. Autodesk.
Azhar, S. (2011). Building information modeling (BIM): Trends, benefits, risks, and challenges for the AEC industry. Leadership and Management in Engineering, 11(3), 241–252.
Ball, A. (2013). Preserving Computer-Aided Design (CAD). DPC Technology Watch Report. https://scholar.google.com/citations?user=efU9l9oAAAAJ&hl=en&oi=sra
Borkowski, A. S. (2023). Evolution of BIM: Epistemology, genesis and division into periods. Journal of Information Technology in Construction. https://repo.pw.edu.pl/info/article/WUT82f55e934e0f47e09076418a8834e008
Borrmann, A., König, M., Koch, C., & Beetz, J. (2018). Building information modeling: Why? What? How? In Building Information Modeling (pp. 1–24). Springer International Publishing.
Deng, M., Menassa, C. C., & Kamat, V. R. (2021). From BIM to digital twins: a systematic review of the evolution of intelligent building representations in the AEC-FM industry. Journal of Information Technology in Construction, 26, 58–83.
Eastman, C. (1975). The use of computers instead of drawings in building design. AIA Journal. https://www.researchgate.net/profile/Charles-Eastman/publication/234643558_The_Use_of_Computers_Instead_of_Drawings_in_Building_Design/links/54aff5690cf2431d3531c7a7/The-Use-of-Computers-Instead-of-Drawings-in-Building-Design.pdf
Eastman, C. M. (1989). Architectural CAD: a ten year assessment of the state of the art. Computer Aided Design, 21(5), 289–292.
Eastman, C. M. (1991). The evolution of CAD: Integrating multiple representations. Building and Environment, 26(1), 17–23.
Eastman, C., Teicholz, P., Sacks, R., & Liston, K. (2008). BIM Handbook: A Guide to Building Information Modeling for Owners, Managers, Designers, Engineers and Contractors. https://doi.org/10.5555/1796500
Hız, Y., Altunel, E., Güngör, S., & Öztürk, S. (2023). Current research in architecture, planning and design. Gece Kitaplığı.
Izbash, Y., & Babayev, V. (2024). Digital evolution in AEC industry: Bridging BIM, building codes, and future technologies. IOP Conference Series. Earth and Environmental Science, 1376(1), 012004.
Laakso, M., & Kiviniemi, A. (2012). The IFC standard-A review of history, development, and standardization. Journal of Information Technology in Construction, 17, 134–161.
Liu, Z., Lu, Y., & Peh, L. C. (2019). A review and scientometric analysis of global Building Information Modeling (BIM) research in the architecture, Engineering and construction (AEC) industry. Buildings, 9(10), 210.
Olawumi, T. O., Chan, D. W. M., & Wong, J. K. W. (2017). Evolution in the intellectual structure of Bim research: A bibliometric analysis. Journal of Civil Engineering and Management, 23(8), 1060–1081.
Sacks, R., Eastman, C., Lee, G., & Teicholz, P. (2018). BIM handbook: A guide to building information modeling for owners, designers, engineers, contractors, and facility managers. https://books.google.com/books?hl=en&lr=&id=IU9mDwAAQBAJ&oi=fnd&pg=PR17&dq=BIM+Handbook+(3rd+ed.).+Wiley&ots=NgnvMw1vyJ&sig=vsq2-kPApnCwXaHInBfGTu7pVag
Tornincasa, S., & Monaco, F. D. (2010). THE FUTURE AND THE EVOLUTION OF CAD. tmt.unze.ba. https://tmt.unze.ba/zbornik/TMT2010/Keynote-Tornincasa.pdf
Weisberg, D. E. (2008). The engineering design revolution: the people, companies and computer systems that changed forever the practice of engineering. Cyon Research Corporation.
Wolfe, L. S. (July-Sep 2025). How CAD Became Universal. IEEE Annals of the History of Computing, 47(3), 14–25.
Zhang, Z., & Zou, Y. (2022). Research hotspots and trends in heritage building information modeling: A review based on CiteSpace analysis. Humanities & Social Sciences Communications, 9(1), 394.
The end
Read next ↓