
Articles
AI时代是使用通用AI、引入专用AI代理产品还是自主开发——基于最新研究与案例的系统导入思考方式
Product
Career
Overview
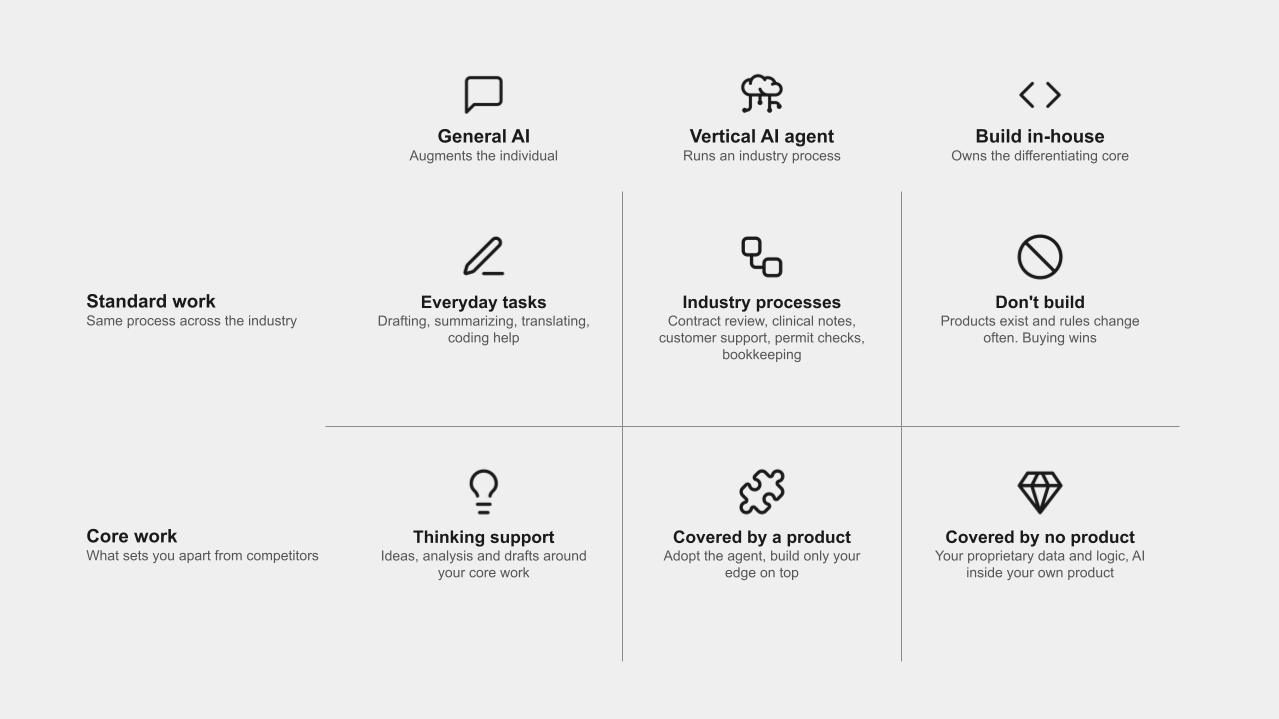
When enterprises build their own AI, only 5% of those efforts ever reach production. The way to raise the odds is not to build everything yourself, but to put each option where it belongs: general-purpose AI, vertical AI agents, and in-house builds, each matched to the right kind of work. Drawing on the research and case history of IT project failure, together with enterprise AI surveys published from 2025 onward, this column lays out how to choose among the three based on the nature of the work. The conclusion comes down to two principles: buy the model, own the data, and choose the workflow by the nature of the work; and when in doubt, start with general-purpose AI and move toward vertical agents and in-house builds in a reversible sequence.
Introduction
AI is advancing at a remarkable pace, and for nearly every company and organization, adopting it has become a question that must be considered. There are broadly two options: adopt an off-the-shelf product, or build in-house. For AI, adopting an off-the-shelf product further splits into two choices, adopting general-purpose AI or adopting vertical AI agents. Which to choose depends on the work being targeted, and this column organizes that reasoning in light of the latest research and practical cases.
This column’s novelty lies in the following four points.
It compares success cases, failure cases, and success rates for off-the-shelf products versus in-house builds: IT project failure has generated a wealth of cases and statistics, but few analyses put adopting off-the-shelf products and building in-house on the same footing and compare both their successes and their failures. This column sets the success and failure cases of each side by side, along with the success rates reported in survey research, and shows that the answer is not the simple conclusion that one option is safer than the other.
It organizes the failure factors along the stages of system adoption, with no gaps and no overlaps: Software engineering, behavioral economics, and information systems research have each accumulated their own body of work on failure factors, but they speak in different vocabularies, which makes it hard for practitioners to see the whole picture. This column places the factors along five stages, from planning through operation, and distinguishes the factors specific to off-the-shelf adoption, those specific to in-house builds, and those common to both.
It lets you decide which work suits off-the-shelf products and which suits building in-house using management theory: The theories of Williamson (1985), Barney (1991), Carr (2003), Wardley (2020), and others are translated into four decision axes, differentiation, asset specificity, market maturity, and pace of change, so that the sourcing model can be derived from the nature of the work.
It maps the three options, general-purpose AI, vertical AI agents, and building in-house, to the work they suit, including whether or not they are customized: Enterprise surveys published from 2025 onward (MIT NANDA, 2025; Menlo Ventures, 2025) show that in AI, too, in-house builds reach production at roughly half the rate of off-the-shelf products. This column distinguishes general-purpose AI from vertical AI agents on three dimensions, the market they target, the value they deliver, and the knowledge built into them, and then identifies the work each suits when used as is and when customized.
Success and Failure Cases in System Adoption
Before weighing any adoption decision, it helps to first establish what kinds of successes and failures are actually occurring. Failure is not a phenomenon confined to in-house builds; it recurs in off-the-shelf adoption as well. At the same time, the success cases reveal that each approach, buying and building, has clear conditions under which it works.
Adopting Off-the-Shelf Products
Success Cases: Adopting Off-the-Shelf Products
What the successful off-the-shelf adoptions share is that the organization adapted its work to the product’s standard, rather than reshaping the product to fit its work, and that it rolled the product out in phases.
Hershey (2002): Succeeding with the same product three years after failing: After a big-bang ERP cutover in 1999 caused a massive shipping breakdown, Hershey carried out a major upgrade of the same SAP system in 2002, this time finishing ahead of schedule and roughly 20% under budget (Koch, 2002). What changed was not the product but the approach: the company switched over during a slack period in demand, allowed ample time for testing and training, and migrated in phases, all of which are credited for the success.
Nike (2001–2006): Shifting to a phased rollout: Nike lost roughly $100 million in sales opportunity in 2000 through a failed demand-forecasting system rollout. For its subsequent overhaul of core enterprise systems, it changed course to a policy of never switching everything at once, rolling the systems out region by region and process by process over several years. That shift allowed it to complete the overhaul by 2006 without any major breakdown (Koch, 2004).
Netflix (2008–2016): Buy the platform, build the differentiator: A database failure in 2008 prompted Netflix to begin migrating from its own data centers to AWS, and it shut down its last data center in 2016 (Netflix, 2016). It relies on external cloud for infrastructure such as servers and databases, while continuing to build in-house the parts that form the core of its differentiation, such as its recommendation algorithms and streaming control. It is a textbook case of drawing a clear line between what to buy and what to build.
Capital One (2020): A financial institution’s full migration to the cloud: Capital One, one of the largest banks in the United States, closed all eight of its data centers and moved its infrastructure entirely to AWS in 2020 (Capital One, 2020). It demonstrated that even a financial institution in a regulated industry can hand its infrastructure layer to an external product and concentrate its own development resources on customer-facing applications and data analytics.
Failure Cases: Adopting Off-the-Shelf Products
What the failed off-the-shelf adoptions share is that the organization did not use the product as standard but heavily reworked it to fit its own processes, or that it got the cutover method wrong.
FoxMeyer Drug (1996): FoxMeyer, a major US pharmaceutical wholesaler, failed in its rollout of SAP R/3 and a warehouse automation system and filed for bankruptcy in 1996. The causes are attributed to transaction volumes far beyond what was anticipated and the complexity of a warehouse consolidation run in parallel, and it has become the emblematic case of ERP failure. For example, the new system could reportedly process only about 10,000 orders a night, far below the roughly 420,000 the old system had handled, leaving the company persistently unable to fulfill incoming orders.
Hershey (1999): The confectionery giant Hershey brought three systems, ERP, customer management, and supply chain planning, live simultaneously, right before the Halloween demand peak. Chaos in order processing left roughly $100 million worth of orders unshipped, and quarterly profit fell 19%. A compressed implementation schedule and the big-bang cutover approach are identified as the main causes.
Lidl (2018): The German retail giant Lidl canceled its SAP implementation in 2018 after seven years and roughly €500 million. Where SAP’s standard values inventory at retail price, Lidl insisted on its traditional practice of managing it at purchase price, and the mounting large-scale customization that followed is cited as the cause of the collapse (Handelsblatt, 2018).
Birmingham City Council (2022–): Birmingham, the largest local authority in the UK, saw the budget for migrating its core enterprise systems from SAP to Oracle Fusion swell from an initial £19 million to more than £100 million, disrupting its financial reporting and audits. External auditors pointed to excessive customization of processes that standard functionality should have handled as one of the main causes (Grant Thornton UK LLP, 2023). For example, bank reconciliation, a task the standard functionality should have covered, was given a bespoke design; as a result, reconciliation reverted to manual work and tens of thousands of unprocessed items reportedly piled up.
Building In-House
Success Cases: Building In-House
What the successful in-house builds share is that the work was the core of competitive advantage, no suitable product existed in the market, and the organization had the capability to keep developing and improving.
Walmart (1990s–): A proprietary supply chain system: In 1991 Walmart built Retail Link, a proprietary system for sharing sales and inventory data with its suppliers. By disclosing store-level sales results to suppliers in real time, it pulled far ahead of competitors in the accuracy and speed of replenishment. Bessen (2022) argues that proprietary software of this kind, unavailable on the market, became the source of the company’s advantage in retail.
Amazon (2000s–): Internal infrastructure that became a business in its own right: Amazon built its own compute, storage, and database infrastructure to support its retail business, then began offering it externally as AWS from 2006, growing it into the business that now generates the majority of the company’s profit. It is a case in which an in-house system went beyond improving the company’s own operations and became a new business in itself, arguably the strongest form of justification for proprietary development.
Inditex (Zara) (2000s): A simple proprietary system fitted to the business model: Inditex, the company behind Zara, built in-house the systems connecting store terminals to headquarters production planning in order to support its distinctive operating model, which moves from design to shelf in two weeks. Ferdows et al. (2004) observe that although the company’s systems are technically simple, they fit the business model perfectly and produce a competitive advantage that off-the-shelf products could not deliver.
JPMorgan Chase (2024–): In-house AI in a regulated industry: JPMorgan Chase built LLM Suite, an in-house platform for using external foundation models on its internal infrastructure, began rolling it out in 2024, and scaled it to roughly 200,000 employees by 2025 (JPMorgan Chase, 2025). The case brought together every condition: financial regulation that prevents confidential data from leaving the firm, a vast technology organization with a technology budget of several billion dollars a year, and proprietary data as the core of differentiation.
Failure Cases: Building In-House
What the failed in-house builds share is that they attempted to construct an enormous proprietary system in one piece over a long period, that no one was responsible for integrating the deliverables of multiple organizations, and that the requirements kept changing until the very end.
The UK NHS National Programme for IT (NPfIT): Launched in 2002, the UK National Health Service’s program to integrate electronic health records was effectively dismantled in 2011 after more than £10 billion had been spent. The House of Commons Public Accounts Committee described it as one of the worst IT fiascos in history (House of Commons Committee of Public Accounts, 2013). The main causes are held to be the attempt to build a huge proprietary system centrally and all at once, the failure to accommodate the differing requirements of individual healthcare providers, and the breakdown of relationships with the contracted developers. For example, despite the goal of a single nationwide electronic health record, clinical procedures and record formats differed from hospital to hospital, and the developers withdrew one after another before the system could be shaped into something frontline staff could use.
Healthcare.gov in the United States: When the health insurance exchange website launched in October 2013, only a handful of people were able to complete enrollment on opening day out of millions who tried, and a major rescue effort was required. Audits found that no one was responsible for integrating the proprietary system that multiple contractors had developed in separate pieces, that requirements kept changing right up to launch, and that load testing was not carried out until just before go-live (U.S. Government Accountability Office, 2014).
Hertz’s website and app development: The car rental giant Hertz commissioned a consulting firm in 2016 to develop a new website and mobile app, then sued in 2019 for the return of $32 million plus damages, claiming the deliverables did not work. The dispute centered on changing requirements, missing mobile support, and inadequate testing, and the case showed that outsourcing a proprietary build does not make it a problem that can be solved by switching vendors. For example, the two sides disagreed over whether support for tablet screen sizes was included in the contract, which exposed the buyer’s lack of capability to define requirements clearly and to verify what was delivered.
Core banking systems at financial institutions: Core banking replacements at major banks tend to be multi-year proprietary builds costing hundreds of billions of yen, and cases of repeated large-scale outages after go-live have been reported in many countries. The analysis points to requirements and technology changing over a long development period, the difficulty of integrating deliverables from multiple vendors, and the absence, after go-live, of anyone inside the organization who understands the system as a whole. For example, in a project that took nearly ten years to build, the technology chosen at the outset was a generation old by the time the system went live, and merely securing engineers able to maintain it became a challenge in itself.
Success Rates in System Adoption
Individual cases alone cannot tell us how often each sourcing model actually succeeds. This chapter turns to the success rates reported by research.
Success Rates When Adopting Off-the-Shelf Products
ERP (core enterprise systems) succeed a little under 50% of the time: ERP is the archetypal off-the-shelf adoption. Panorama Consulting Group’s (2023) ongoing survey reports that roughly half of adopting companies overrun their budget or schedule, and fewer than half say they fully realized the benefits they originally expected. On the other hand, catastrophic failures are rare, because the projects are smaller and easier to abandon. Off-the-shelf products can be contracted and cancelled one business area at a time, which caps both the investment per project and the loss when one fails. For example, if a sales-support tool fails to take hold, the loss is limited to a few months of subscription fees plus migration costs; it rarely threatens the company’s survival.
Only about 60% of SaaS licenses get used: Even when the rollout itself is complete, a widespread form of failure is that the licenses a company pays for go unused. Zylo (2023) found that roughly 40% of the SaaS licenses enterprises hold are idle, wasting about $17 million per company per year. For example, when each department signs its own project management tool, a company can end up running five tools of the same kind side by side, none of which takes root.
In AI adoption, off-the-shelf products succeed at twice the rate of in-house builds: MIT NANDA (2025) reports that AI tools adopted through partnerships with external vendors reached production about 67% of the time, while tools built in-house reached production only about 33% of the time. Choosing an off-the-shelf product does not guarantee success, but it raises the odds substantially, and that holds for AI as well.
Success Rates When Building In-House
In-house builds succeed about 30% of the time: The Standish Group’s long-running CHAOS reports find that only around 30% of software projects meet all three criteria of budget, schedule, and satisfaction; about 20% are cancelled or never used; and the remaining half are completed but over budget, late, or short on functionality (Standish Group, 2015, 2020). The definition of success and the sample are debated, but the ratio has barely moved in more than 20 years.
By project size, in-house success rates range from 6% for large projects to 61% for small ones: In the Standish Group’s (2015) breakdown by size, small projects (under $1 million) succeed 61% of the time, while large projects (over $10 million) succeed only 6% of the time and fail outright (cancelled or unused) 43% of the time. Success rates fall sharply as projects grow. A McKinsey and University of Oxford study of more than 5,400 IT projects found that large projects with budgets of $15 million or more ran 45% over budget and 7% over schedule on average, and delivered 56% less value than originally expected (Bloch et al., 2012). For example, even with the same organization and the same development team, splitting the work into ten ¥100 million projects versus running a single ¥1 billion project makes a real difference: the probability that the single large project “hits budget, schedule, and value all at once” drops to roughly one-tenth of the smaller projects’ odds.
Custom-built AI succeeds 5% of the time: MIT NANDA (2025) reports that for custom enterprise AI tools, 60% of companies reached the evaluation stage, 20% advanced to a pilot, and only 5% made it to production. Compared even with conventional software development, in-house AI faces a far higher barrier to reaching production.
Why System Adoption Fails
This chapter lays out the failure factors for off-the-shelf adoption and for in-house builds. We divide system adoption into five stages, “Planning and Investment Decision,” “Requirements and Product Selection,” “Design, Development, and Customization,” “Testing, Migration, and Go-Live,” and “Operation, Maintenance, and Evolution,” and map the factors that arise in each.
Failure Factors When Adopting Off-the-Shelf Products
With an off-the-shelf product, the vendor handles the design, development, and maintenance of the product itself. The failure factors therefore cluster in the “choosing the product” stage, the “fitting the product to your organization” stage, and in “change on the organization’s side.”
Stage 1: Planning and Investment Decision
Choosing the wrong sourcing model: This is the decision to cover work that forms the core of your differentiation with a standard product. As the resource-based view (Barney, 1991) shows, a product anyone can buy on the market cannot be a source of competitive advantage, so replacing the very work that constitutes your strength with an off-the-shelf product means losing that strength. For example, a retailer that beat its competitors on the accuracy of its proprietary demand forecasting switches to a standard forecasting module and finds its accuracy “leveled down” to match everyone else’s.
Leaving complementary investments out of the budget: Brynjolfsson et al. (2021) described the “productivity J-curve,” in which the benefits of general-purpose technologies such as IT and AI fail to appear at first and accelerate only later. The reason is that these technologies require complementary investments in intangible assets, including redesigning business processes, retraining people, and changing organizational structures, and those investments come first as unmeasured costs. In off-the-shelf adoption, the typical pattern is to budget only “license fees and implementation support” while never estimating the frontline effort and training needed to align the work with the standard. For example, a company rolls out an expense reimbursement system but never revises its approval rules or trains its managers, so paper forms and system entry keep running in parallel.
Assuming that “once it’s in, the benefits will follow”: As Aral and Weill (2007) showed, the return on IT investment is determined by organizational capability, not by the amount invested. A decision that expects results from reading a product’s feature list is missing this premise. For example, a CRM system delivers nothing more than an “expensive address book” unless sales reps form the habit of logging their deals and managers actually use those records to coach.
Stage 2: Requirements and Product Selection
Overlooking the misfit between the work and the product: Davenport (1998) observed that enterprise systems such as ERP embed the vendor’s assumptions about “how work should be done,” forcing the adopting company into a strategic choice: adapt the system to the work, or adapt the work to the system. Soh et al. (2000) classified product-organization misfits into three types, data, function, and output, and showed that when adoption proceeds without evaluating these misfits at the selection stage, the company is forced to resolve them later through customization. For example,
Failing to assess the continuity of the vendor and the product: This is signing a contract after comparing nothing but features, without evaluating the vendor’s financial health, customer base, product roadmap, what happens if the vendor is acquired, or how data can be exported. As Shapiro and Varian (1999) showed, software ties data formats, business procedures, and employee skills to a specific product, which makes switching expensive. For example, a company rolls out a startup’s time-and-attendance tool company-wide, the vendor is then acquired, and a year later the service is slated for shutdown, but the contract never included a way to bulk-export the historical attendance data.
Insufficient capability on the buyer’s side: A review of IT outsourcing research (Lacity et al., 2009) consistently reports that even when work is handed to outside parties, outcomes depend on the buyer retaining the ability to define requirements and to evaluate and govern vendors. A company that has lost this ability cannot assess vendor proposals and ends up contracting for unnecessary features and customizations on the implementation partner’s say-so. For example, a company that downsized its IT department in favor of outsourcing could not explain, at ERP renewal time, “which settings each business process needs,” so the implementation partner simply carried over the previous configuration, and the company kept paying for functionality that served processes it had already discontinued.
Stage 3: Design, Development, and Customization
Excessive customization: Brehm et al. (2001) classified ERP tailoring into nine levels, from “configuration (changing parameters)” to “modifying the package’s source code,” and showed that the deeper the level, the greater the technical risk, maintenance cost, and loss of vendor support. Many companies lump all of this together as “customization,” but an adjustment that stays within configuration and a modification that touches the code are entirely different in nature. For example, changing an approval flow from three steps to four on a settings screen is configuration; adding a company-specific rule such as “when the department head is absent, approval by two section managers substitutes” as program code is modification, which must be re-verified and repaired with every product upgrade, driving up maintenance costs and ultimately costing you vendor support.
Integration sprawl: Even without touching the product itself, building a large number of integrations with other systems turns the integration layer into a de facto custom system. For example, a company builds dozens of data integrations between its ERP and its existing sales management, warehouse, and accounting systems; from then on, every upgrade of any one product requires retesting all of the integrations, and the company ends up in a state where “we bought the product, but we need a dedicated team just to maintain the integrations.”
Configuration sprawl and key-person dependency: Even configuration that involves no code can accumulate over the years until no one understands the whole picture. For example, a CRM system gains several hundred fields and automation rules over ten years, to the point where adding a new rule interferes with existing ones and produces unexpected behavior.
Stage 4: Testing, Migration, and Go-Live
Neglecting testing and data migration: On the assumption that an off-the-shelf product is “guaranteed to work,” companies tend to skip testing of end-to-end business scenarios that include their own configuration, data, and integrations. Somers and Nelson (2001), surveying the success factors of ERP adoption, list “data accuracy” and “software testing” as critical factors during the implementation stage, and Redman (1998) lays out the mechanisms by which poor-quality data drives up a company’s operating costs. For example, a billing process that works correctly in the product on its own produces duplicate invoices because the customer data migrated from the legacy system contained inconsistencies, such as the same customer registered under several different spellings.
The risk of a big-bang cutover: Switching from the old system to the new one all at once maximizes the blast radius when something goes wrong. Hershey brought three systems live simultaneously just before its peak demand season and threw its order processing into chaos. Phased rollouts and parallel running cost money, but they act as insurance against large-scale failure. For example, the same Hershey succeeded with its 2002 upgrade by choosing the off-season and switching over in phases, the mirror image of that earlier lesson.
Lack of frontline acceptance: Off-the-shelf products assume that the way work gets done will change, so if the frontline does not accept the change, people “revert” to old procedures and personal spreadsheets right after go-live. For example, after a new purchasing system goes live, frontline staff keep placing orders by phone as before and enter them into the system afterward; this “catch-up entry” becomes the norm, and inventory data drifts away from reality.
Stage 5: Operation, Maintenance, and Evolution
Vendor policy changes and lock-in: As Farrell and Klemperer (2007) laid out theoretically, switching costs give vendors pricing power. The textbook case is Broadcom’s 2023 acquisition of VMware, after which perpetual licenses were discontinued in favor of subscriptions and many companies saw their costs multiply several times over. Product discontinuation and the vendor’s own bankruptcy or acquisition belong to this factor as well.
The maintenance burden of customized components: The modifications made to the product in Stage 3 must be re-verified and repaired with every product update. As Erlikh (2000) showed, the bulk of software lifecycle cost is maintenance, and maintaining the modified parts falls on your own organization. For example, every time a cloud ERP pushes one of its four automatic updates a year, it takes weeks to verify the custom reports and processing logic the company added, and the updates become a “burden” rather than an “improvement.”
Delayed organizational change and failure to embed: Even once the system is live, the benefits do not appear unless business processes and the organization change. As Aral and Weill (2007) showed, organizational capability is what determines the return, and the failure to budget complementary investments in Stage 1 surfaces at this stage as an “unused system.” For example, the “roughly 40% of licenses unused” finding from the Zylo (2023) survey cited in the previous chapter is this failure in aggregate.
SaaS sprawl and fragmented data: This is what happens when each department signs its own SaaS contracts: the same data ends up scattered across multiple systems, and a company-wide view becomes hard to obtain. For example, sales, customer support, and marketing each use a different CRM tool, and the same customer’s information conflicts across the three.
Failure Factors When Building In-House
When you build in-house, your organization owns every stage from planning through maintenance, so the failure factors surface across all five stages. What stands out is that two kinds of factors grow more severe in proportion to a project’s size and duration: those rooted in properties intrinsic to software, such as the volatility of requirements, complexity, and maintenance cost, and those rooted in human judgment, such as the planning fallacy and escalation of commitment. Whatever a vendor would absorb for you in an off-the-shelf adoption, you absorb yourself when you build.
Stage 1: Planning and Investment Decision
Choosing the wrong sourcing model: This is the decision to build work in-house that does not contribute to differentiation. Transaction cost theory (Williamson, 1985) shows that work that is standard, has stable requirements, and can be sourced from many suppliers is more rationally bought from the market, yet in practice the judgment gets distorted by the assumption that “our work is special” or by historical circumstance. As Carr (2003) pointed out, over-investing in commoditized technology domains adds cost and risk without producing advantage. This misjudgment becomes the origin of failures in every stage that follows. For example, many companies have built their own systems for accounting, payroll, or time and attendance, work whose procedures are largely fixed by law, on the grounds that “the packages don’t fit how we operate,” and keep paying for modifications every time the law changes.
Underestimating cost and duration through the planning fallacy: Kahneman and Tversky (1979) identified a tendency for people making plans to ignore comparable past cases (the outside view) and estimate from the details of the plan in front of them (the inside view). The result is that duration and cost are systematically underestimated. As a countermeasure, Flyvbjerg (2006) proposed “reference class forecasting,” which corrects estimates against the actual distribution of outcomes from similar projects. The power-law research from the previous chapter (Flyvbjerg et al., 2022) empirically shows what that reference class looks like, and the larger the custom build, the fatter the tail of the distribution. For example, an estimate such as “the requirements are settled, so we will finish in 18 months” is a textbook inside view: it ignores that projects of this kind follow a distribution with an average overrun of 27% and one in six running to three times the budget (Flyvbjerg & Budzier, 2011).
Leaving complementary investments out of the budget: As with off-the-shelf products, the costs of process redesign, training, and organizational change are placed outside the “development budget” (Brynjolfsson et al., 2021). In-house builds add a further gap: the staff needed for the operating organization after launch (monitoring, user support, incident response) often go unestimated. Lientz and Swanson (1980) showed in a large-scale survey that the effort required for post-launch maintenance and operation exceeds development effort, so a plan that excludes this effort from the budget is structurally short. For example, a system built by a ten-person development team goes live, and half the team ends up pinned down on incident response and change requests, unable to start the next project.
Scope bloat and the all-at-once mindset: The decision to build several business domains as one giant system in a single effort inflates scale, duration, and integration complexity all at once. Flyvbjerg et al. (2022) laid out the mechanism by which interdependencies among technical components trigger chain reactions that lead to extreme cost overruns, and Flyvbjerg and Gardner (2023) showed that modular projects, assembled by repeating small units, are far safer than all-at-once builds. The NHS’s NPfIT is a case that illustrates where the all-at-once mindset leads (House of Commons Committee of Public Accounts, 2013). For example, deciding that “since we’re building it anyway, let’s integrate sales, inventory, accounting, and HR all together” deliberately creates a structure in which a delay in any one domain affects every other.
Stage 2: Requirements and Product Selection
Requirements always change once people start using the system: Brooks (1987) argued that software has “essential difficulties” that no tool or method can remove, and that one of them is changeability: the property that once software is in use, changes will inevitably be demanded. Users only recognize what they truly need after they see something working, and laws and business processes change during development, so however carefully you pin down requirements, “done when finished” never happens. With an off-the-shelf product the vendor takes on this ongoing change; with an in-house build, you chase it forever.
No one owns the requirements: An in-house build needs an owner on the business side, the commissioning side, who decides “what to build” and who holds development knowledge and technical skill on a par with the staff of a systems integrator. The development team, including any outsourced developers, can decide “how to build,” but only someone who knows the work can decide “which processes, in what order, and how far.” Hofmann and Lehner (2001) showed that the degree of business-side involvement is the strongest single predictor of project success or failure, and Standish Group (2015) also ranks “user involvement” as the top success factor. When development starts without this owner, the requirements get filled in by the outsourced systems integrator’s guesses or by imitation of the current system. For example, the business unit says only “it just needs to do what the current system does,” the development team reproduces the existing screens one by one, and the result is a system that merely rebuilds 20-year-old work procedures on new technology.
The buyer lacks capability (when outsourcing): When an in-house build is outsourced, the commissioning organization cannot evaluate the deliverables unless it retains the ability to define requirements and assess progress and quality (Lacity et al., 2009; Feeny & Willcocks, 1998). The case of the US rental-car giant Hertz (which sued its contractor Accenture for more than $32 million in damages, claiming that the project to completely overhaul its website and mobile app had failed) can be read as an example of this capability gap left unaddressed until it ended in litigation (Hertz Corp. v. Accenture LLP, 2019). For example, a pattern in which the monthly progress reports from the contractor keep being accepted as “on track,” and the buyer discovers only three months before delivery that the main functions do not work.
Stage 3: Design, Development, and Customization
Cascading delays from complexity and interdependence: Brooks’s (1975) law that “adding manpower to a late project makes it later” stems from the fact that communication costs grow with the square of the number of people. A custom-designed system has many interdependencies among its components, so a delay or design change in one place cascades into the others. This chain reaction is also what Flyvbjerg et al. (2022) identified as the mechanism behind extreme cost overruns. For example, a change to the database design ripples into every screen, report, and integration process that references it, and a week of changes turns into three months of rework.
Accumulating technical debt: As Cunningham (1992) showed with the metaphor of “technical debt,” design compromises made to hit a deadline keep driving up the cost of every subsequent change. In an in-house build, you have to plan and carry out the repayment of that debt (refactoring) yourself. For example, the same logic gets copied into several places “just to get it working,” and from then on every specification change requires hunting down and fixing every copy, with defects from missed spots recurring again and again.
No one owns integration: When several development firms or departments split the work, there can be no party that integrates the whole and takes responsibility for its quality. The audit of Healthcare.gov (U.S. Government Accountability Office, 2014) named the absence of an integration lead as a primary failure factor. For example, the firm responsible for the screens, the firm responsible for data processing, and the firm responsible for connections to external agencies each report that “our part is complete,” yet nothing works when the pieces are connected.
Choosing the wrong technology: In a long development effort, the technology chosen at the outset may be obsolete by completion, or you may pick a technology that only a few specific engineers can handle. Bisbal et al. (1999) laid out how the “legacy systems” born this way come to obstruct organizational change as the pool of people able to maintain them shrinks and the technology ages. The US Government Accountability Office has reported that many of the federal government’s core systems are written in languages that are decades old and that the retirement of the engineers who can maintain them is an imminent risk (U.S. Government Accountability Office, 2016). For example, a language is adopted on the judgment of a lead who is fluent in it, no successor can be hired after that person retires, and maintenance grinds to a halt.
Stage 4: Testing, Migration, and Go-Live
Neglecting testing and data migration: Load testing, acceptance testing based on business scenarios, and verification of data migrated from the old system get squeezed under deadline pressure. At Healthcare.gov, load testing was not performed until just before launch; at Hertz, inadequate testing of mobile support became a point of dispute. For example, although it was foreseeable that traffic on opening day would be ten times the assumption, testing at that load was performed for the first time one week before launch, and when problems were found there was no time to fix them.
The risk of big-bang cutover: Switching from the old system to the new one all at once maximizes the blast radius when something goes wrong (Markus & Tanis, 2000). In-house builds are especially prone to big-bang cutover because of the reasoning “we don’t want to pay the double running costs of parallel running.” For example, the UK’s TSB Bank migrated its customer accounts to a new core banking platform in a single cutover over a weekend in April 2018; from the following week, roughly 1.9 million customers were unable to use online banking, and the bank booked a loss of about £330 million in recovery costs and customer compensation. The independent investigation identified the decision to proceed with a big-bang cutover despite inadequate pre-migration testing as the primary cause (Slaughter and May, 2019).
Escalation of commitment: unable to stop: Keil (1995) analyzed the phenomenon in which IT projects that are visibly failing are continued and receive further investment, calling it “escalation.” Attachment to the money already spent, the reputations of those in charge, and the misperception that “we’re almost done” all delay the decision to withdraw. Because withdrawing from an in-house build tends to mean a total loss of the investment, escalation drags on longer. For example, within a few years of its start, it was already clear that the NHS’s NPfIT had lost its main development contractors and that frontline adoption was not progressing, yet the decision to dismantle it was deferred until 2011 on the grounds that “billions of pounds have already been invested.”
Stage 5: Operation, Maintenance, and Evolution
Underestimating maintenance cost: Since the classic survey by Lientz and Swanson (1980), it has been repeatedly confirmed that maintenance and operation account for more than half of software lifecycle cost, and Erlikh (2000) estimated that for enterprise systems the share reaches 85–90%. Comparing an in-house build against an off-the-shelf product on the basis of “development cost” ignores the majority of the cost. For example, a system that costs ¥100 million to develop typically requires an additional ¥200–500 million over ten years for maintenance, modifications, and platform upgrades, which is typically tens of times more than ten years of subscription fees for an off-the-shelf product.
Continuous change and generational shifts in underlying technology: Lehman’s (1980) “laws of software evolution” show that a program in real use loses user satisfaction unless it is continually changed, and that the more it is changed, the more complex it becomes. On top of this, OS and browser updates, responses to security vulnerabilities, tracking of legal and regulatory changes, and generational shifts in underlying technology such as moves to the cloud or to APIs arise continuously as “defensive maintenance” simply to preserve value. For example, many systems built in the early 2010s have been forced into modifications at every browser specification change, every end of support for a server OS, and every update to encryption standards, ending up in a state where “nothing about the functionality has changed, yet it costs money every year just to keep it running.”
Staff turnover and knowledge concentrated in a few people: Knowledge of a custom system accumulates in the people who built it. Rigby et al. (2016) quantified how much software knowledge is lost when developers leave, and showed that the share of code understood by only one specific person determines the maintenance risk after that person departs. Systems “whose internals nobody understands,” created by the transfer or retirement of the people in charge, are a phenomenon common to many companies. With off-the-shelf products, knowledge of the standard functionality circulates in the market, which makes them far more resilient to staff turnover. For example, a system is modified repeatedly for ten years without its design documents being updated, the one person who understood the whole retires, and from then on it becomes a system that “nobody touches, because touching it breaks it.”
Delayed organizational change and failure to embed: As with off-the-shelf products, even when a system is up and running, no benefits appear unless business processes and the organization change (Aral & Weill, 2007). Because in-house builds tend toward requirements that “reproduce current work as is,” they can miss the opportunity for process improvement altogether. Hammer (1990) called automating existing work procedures as they stand “paving the cow paths” and criticized it as the archetype of effort that produces no benefit. For example, a system that turns a paper application form into a screen, unchanged, does not reduce the effort of data entry; it creates double work, as people fill in the paper form and then enter the same data into the system.
How the Failure Factors Differ Between Buy and Build
What They Share
The starting point, “choosing the wrong sourcing model,” is common to both: The mistake of settling for an off-the-shelf product at the core of differentiation and the mistake of building non-differentiating work in-house both arise from the absence of the same decision axes (differentiation, asset specificity, market maturity). For example, herd judgments such as “because our peers build in-house” or “because our peers use this product” go wrong in either direction.
Neglecting complementary investments and delaying organizational change are organizational problems, not technical ones, and occur under either model: As Brynjolfsson et al.’s (2021) J-curve and Aral and Weill’s (2007) research on organizational capability show, a system’s value comes from changes in business processes and people. For example, a company that neither updates its work procedure manuals nor runs training after a new system goes live ends up with “a system nobody uses,” whether it bought or built.
A shortage of capability on the buyer’s or business side is fatal under either model: The ability to define requirements, evaluate deliverables, and govern vendors or development teams cannot be delegated to outsiders. For example, a company that has shrunk its IT department to the bone can no longer judge the soundness of the other party’s proposals, whether it is selecting an off-the-shelf product or outsourcing an in-house build.
Failures of test discipline and cutover method appear in the same form under either model: Skipping load tests, insufficient verification of data migration, and big-bang cutover cause outages regardless of where the product came from. For example, Hershey (off-the-shelf) and Healthcare.gov (in-house) differ in sourcing model, but they are the same failure in that “testing was not done until just before launch, and everything went live at once.”
Where They Differ
The failures unique to building in-house grow in proportion to scale, duration, and the volume of proprietary code: The planning fallacy, cascading delays, technical debt, maintenance cost, and key-person dependency are all functions of “the amount of custom code the organization owns” and “the project’s scale and duration” (Flyvbjerg et al., 2022; Lientz & Swanson, 1980). For example, for the same “sales management” system, configuring an off-the-shelf product and going live in three months versus spending two years on a custom build means the latter is exposed to changing requirements, staff turnover, and technological obsolescence for eight times as long.
The failures unique to adopting off-the-shelf products concentrate in the evaluation at the selection stage and in the depth of customization: Overlooking the misfit between the product and your own work and under-evaluating the vendor appear in Stage 2, over-customization in Stage 3, and lock-in in Stage 5, but all of them are rooted in one decision: “use the product as standard, or build onto it” (Soh et al., 2000; Brehm et al., 2001). The moment you choose deep customization, you also take on the factors unique to building in-house. For example, Lidl was supposedly adopting an off-the-shelf product, but at seven years and €500 million, its scale and duration carried the same risk structure as a large in-house build (Handelsblatt, 2018).
The size of the loss when things fail is larger for in-house builds: Off-the-shelf products come with an exit route, terminating the contract or switching, so the loss from failure tends to be limited to “the fees paid so far plus migration costs,” whereas a failed in-house build tends to mean a total loss of the investment, and the escalation of commitment that Keil (1995) described drags on longer. For example, a failed SaaS adoption often ends with a loss in the tens of millions of yen, whereas most of the roughly £10 billion spent on the NHS’s NPfIT was never recovered.
Responsibility for maintenance and evolution sits in different places: With an off-the-shelf product the vendor handles security, regulatory changes, and generational shifts in underlying technology once for all its customers, whereas with an in-house build your organization carries all of it (Lehman, 1980; Erlikh, 2000). For example, a change in the consumption tax rate or social insurance contribution rates is absorbed by a vendor update in an off-the-shelf product, but in an in-house build it means a modification by your own team every time.
Which Work Belongs in Off-the-Shelf Products and Which Belongs In-House
Everything so far points to one conclusion: the key to avoiding failure lies in deciding which work to run on off-the-shelf products and which to build in-house. And that decision has to be made task by task, not for the system as a whole.
The Four Decision Axes That Separate Buy from Build
To judge which work suits off-the-shelf products and which suits building in-house, we can draw on four theories that management scholarship has accumulated over decades.
The differentiation axis (the resource-based view): Barney (1991) argued that sustained competitive advantage comes only from resources that are Valuable, Rare, Inimitable, and Organized to be exploited. A product anyone can buy on the market is, by definition, neither rare nor hard to imitate. Building in-house becomes a candidate only when doing this work in your own distinctive way creates an advantage that customers can see. For example, Walmart’s replenishment accuracy and Zara’s speed of merchandise turnover are the very reasons customers choose those companies, so the systems behind them satisfy the differentiation axis.
The asset-specificity axis (transaction cost theory): Williamson (1985) identified three conditions under which making beats buying: high “asset specificity” (you cannot switch trading partners), high “uncertainty” (future requirements cannot be foreseen), and high transaction “frequency.” Nelson et al. (1996) applied this to software procurement, mapping when packaged purchase, custom development, and in-house development each fit along two axes: how unique the work is and how uncertain the requirements are. For example, payroll follows procedures fixed by law and is essentially identical across competitors, so its asset specificity is low and an off-the-shelf product fits.
The market-maturity axis (the theory of commoditization): Carr (2003) argued that IT, like electricity and railroads before it, commoditizes as it spreads and ceases to confer competitive advantage on its own. Wardley (2020) showed that every technology and activity evolves through the stages of “genesis, custom-built, product, commodity,” and that the right way to source it differs at each stage. Something in the genesis stage can only be explored in-house; once it reaches the product stage, buying becomes rational, and once it reaches the commodity stage, pay-as-you-go consumption does. For example, in the early 2000s the only way to get computing infrastructure was to own your own servers; today it is a commodity called the cloud, which made it rational for Netflix to shut down its own data centers.
The pace-of-change axis: Where the requirements that define the work (regulation, technical standards, customer expectations) change quickly, off-the-shelf products gain a large advantage because the cost of keeping up can be pushed outside the organization. Where the work is stable and rarely changes, the maintenance burden of an in-house build is comparatively light (Nelson et al., 1996; Lehman, 1980). For example, in areas with a steady stream of regulatory revisions, such as electronic record-keeping rules and invoicing systems, an off-the-shelf product whose vendor makes one set of changes for all its customers is overwhelmingly more efficient than modifying your own system every time.
Work Suited to Off-the-Shelf Products
Standard back-office work: This is the territory where three axes, differentiation, asset specificity, and market maturity, all point the same way: off-the-shelf. In most companies, 80–90% of work falls here (Carr, 2003; Quinn & Hilmer, 1994). For example, accounting, payroll, expense reimbursement, HR administration, time and attendance, email, file sharing, and web conferencing: customers do not reward you for doing these differently from competitors, mature product markets exist, and frequent updates for regulatory change are required.
Work common across an industry: Work whose procedures are broadly shared within an industry and for which several industry-specific products exist (Davenport, 1998). For example, customer management, inventory management, purchasing, project management, and customer-support ticket handling may look company-specific, but in almost every case they are essentially the same work your competitors do.
Work that looks company-specific but does not differentiate: Work where “our way of doing it” exists, but that way is not itself a reason customers choose you. Here, instead of building the product out, you either align the work to the product’s standard or attach only the unique part externally through integration (Soh et al., 2000; Brehm et al., 2001). For example, a bespoke approval flow, the format of internal reports, or expense account structures that differ by department usually survive only for historical reasons, and conforming to the standard has no effect on the business.
Business flows that connect multiple products: Cases where the work itself is standard but the hand-off of data across several products is company-specific. For example, the chain in which an order received in the order-management system is allocated in the inventory system and billed in the accounting system is best handled by using off-the-shelf products for each step and composing the integration between them with APIs or low-code tools (Hasselbring, 2000).
Fast-changing work with a high cost of keeping up: Work subject to frequent changes in law, regulation, or technical standards, where the pace-of-change axis strongly favors off-the-shelf products (Nelson et al., 1996). For example, tax filing, electronic contracts, and certification for privacy and security are more reliably handled by a vendor that responds to each revision for all its customers at once than by chasing the changes yourself.
Commoditized infrastructure: Areas in the commodity stage on the market-maturity axis, where consuming rather than owning is the rational model (Carr, 2003; Wardley, 2020). For example, servers, storage, databases, identity platforms, and email delivery infrastructure: as the Netflix and Capital One cases show, choosing external cloud services has become mainstream even for regulated industries and very large enterprises (Netflix, 2016; Capital One, 2020).
Work Suited to Building In-House
Work at the core of differentiation, with no product on the market: Work that scores high on both differentiation and asset specificity, and that sits in the genesis or custom-built stage of market maturity. As Bessen (2022) showed, proprietary software has become a source of competitive advantage for large companies, but only when three conditions coincide: the work itself is the source of differentiation, no software that supports it exists on the market, and the organization has the capability and capital to sustain development and continuous improvement. For example, when Walmart’s Retail Link, Zara’s production planning system, and Amazon’s logistics and recommendation systems were built, no product on the market could do the same thing.
Analysis and decision systems that exploit proprietary data: Areas where you use data only you hold (customer behavior histories, decades of transaction records, proprietary measurement data, and so on) and where the way you exploit it translates into competitive advantage. As Teece’s (1986) theory of complementary assets shows, the value resides not in the system itself but in the complementary asset, the data. For example, when an insurer builds its own rating model from decades of claims data, it uses existing cloud platforms and libraries as the foundation for building the model, while developing the rating logic itself in-house.
The “company-specific part” of a differentiating core where products do exist: Cases where most of the work can be handled by an off-the-shelf product, but a small piece of logic that drives competitive advantage is unique to you. Here, rather than modifying the product, you build the unique part in-house as a separate system and connect it to the product loosely through APIs. As Baldwin & Clark (2000) showed, modules separated by standardized interfaces can evolve independently, and Christensen & Raynor (2003) observed that profit migrates to the layers adjacent to a commoditized one. For example, an e-commerce site can run on an off-the-shelf platform while the pricing algorithm and recommendation logic that constitute its competitive advantage are built in-house and plugged into the product through APIs.
When the business itself is software: For a company whose core service is software, that software is by definition the core of differentiation (Andreessen, 2011). For example, Netflix’s streaming and recommendation systems and Amazon’s purchasing experience could not be replaced by off-the-shelf products without the business itself ceasing to function. Even these companies, however, use off-the-shelf products for peripheral work such as accounting, HR, and infrastructure.
Preconditions for Building In-House
Building in-house requires that three preconditions all be met.
The work in question must generate competitive advantage: Doing this work in your own distinctive way must connect directly to why customers choose you. According to Barney’s (1991) resource-based view, only resources that are “valuable, rare, inimitable, and organizationally exploited” generate sustained competitive advantage, and work that can be covered by a product anyone can buy on the market fails this condition by definition. Quinn & Hilmer (1994) argued that a company should keep in-house only the activities in which it can be world-class, and Moore (2005) divided work into “core,” the reasons customers choose you, and “context,” what is necessary but can be done the same way as competitors, noting that core migrates into context over time. What matters here is that the judgment be made from the customer’s point of view, not on the basis of the front line’s claim that “our work is special.” As Soh et al. (2000) showed, much of the work the front line perceives as “special” is merely procedure left over from history and has nothing to do with value for the customer. For example, Walmart’s replenishment accuracy and Zara’s speed of merchandise turnover are the very reasons customers choose their stores, and the systems behind them met this condition (Bessen, 2022; Ferdows et al., 2004). By contrast, the claim that “our approval flow is special because it has five stages” creates no value whatsoever for customers and does not meet it.
No suitable product may exist on the market: This is something to confirm through research, not assumption, before you choose. As Wardley (2020) showed, every technology evolves through “genesis, custom-built, product, commodity,” and continuing to custom-build in an area that has reached the product stage only adds cost and risk (Carr, 2003). In the framework of Nelson et al. (1996), too, building in-house is rational only when “the work is highly unique and no product on the market fits it.” Before starting, therefore, you need to check whether several vendors offer products that cover the work, and whether those products can be applied to your work as standard, or within the bounds of configuration and integration, by actually trialing them. For example, Walmart built Retail Link in-house in 1991 because no product then on the market let it share sales data with suppliers in real time (Bessen, 2022). Conversely, many of the internal document search and summarization systems built in-house in 2023 on the grounds that “no product exists” had, by 2025, been matched or surpassed by several vertical products (Menlo Ventures, 2025). This condition is not checked once and done; it must be re-verified regularly.
The people, budget, and organization to improve and maintain it must be in place: Building in-house is not “build it and you’re done”; the question is whether you can sustain a structure that keeps improving and maintaining the system for five or ten years after it is built. Since Lientz & Swanson (1980), it has been confirmed repeatedly that more than half of a software system’s lifecycle cost goes to maintenance and operation after go-live, and Erlikh (2000) estimated the share at 85–90% for enterprise systems. In other words, choosing to build in-house means committing to bear maintenance costs several times the development cost (tens of times the cost of an off-the-shelf product or more) far into the future. This structure needs three elements. First, people. As Rigby et al. (2016) showed, knowledge of a proprietary system concentrates in the people who built it, so a team of several people who can take over if a key developer leaves, together with documentation, is a prerequisite. Second, budget. By Boehm’s (1981) rule of thumb, annual maintenance runs to around 15–20% of the development cost, and on top of that come the costs of renewal as generations of underlying technology turn over (Lehman, 1980). Third, organization. Feeny & Willcocks (1998) argued that to keep a system serving the business, a company must retain core capabilities in-house, such as thinking that bridges business and technology, control over architecture, and management of vendors and development teams, and Aral & Weill (2007) demonstrated empirically that the returns on IT investment are determined not by the amount invested but by these organizational capabilities. The companies Bessen (2022) identified as having built competitive advantage on proprietary software had, without exception, large technology organizations and sustained investment. For example, JPMorgan Chase could choose to build in-house not only because it had a differentiating core in regulatory constraints and proprietary data, but because it had a technology budget of several billion dollars a year and tens of thousands of engineers (JPMorgan Chase, 2025). Conversely, when an organization with only two or three developers chooses to build in-house, the departure of those few people becomes the lifespan of the system.
Which Work Belongs to General-Purpose AI, Vertical AI Agents, and In-House Builds
This chapter turns to AI specifically. It splits off-the-shelf products into general-purpose AI and vertical AI agents, adds building in-house as a third option, and lays out which kinds of work each of the three is suited to. The four decision axes from the previous chapter apply to AI unchanged, but AI differs from conventional software in important ways, so we start one step earlier: which work is suited to AI in the first place?
Work Suited to AI in the First Place
Unlike conventional systems, AI cuts across business functions, produces probabilistic output, and has capability boundaries that are hard to predict in advance. Before asking “should we adopt AI?”, you therefore need to ask, task by task, “is this work suited to AI?”
Most of the work consists of processing and judging language, documents, and images: Eloundou et al. (2023) estimated that roughly 80% of US workers could see at least 10% of their tasks affected by large language models, and roughly 19% could see more than half of their tasks affected. The impact falls hardest on information work: reading, drafting, summarizing, classifying, and cross-checking documents. For example, contract review, answering inquiries, checking application documents against standards, and writing code all qualify, while physical work on site and face-to-face negotiation do not.
There is a way to check whether the output is right: AI can return different outputs for the same input, and those outputs can contain errors. Work is therefore suited to AI when a human or a separate mechanism can verify whether the output is correct (NIST, 2023). For example, a review task that checks drawings against statutory provisions is a good fit, because the reviewer can confirm the provision the AI cited; a prediction task with no ground truth, where the answer cannot be verified even after the fact, lets AI errors slip through unnoticed.
The work sits inside the boundary of AI’s capabilities: In an experiment with 758 consultants, Dell’Acqua et al. (2023) showed that productivity rose sharply on tasks AI handles well, while on tasks that looked similar but fell outside the boundary, using AI actually lowered the rate of correct answers by 19 percentage points. This “jagged frontier” means you cannot settle the scope of application without actually testing it. For example, within the single category of “document summarization”, summarizing an ordinary report may sit inside the boundary, while reconciling several sources to find contradictions may sit outside it. A small-scale trial on your own real work data before adoption is indispensable.
Skill levels vary widely among staff, leaving plenty of room to raise the floor: Brynjolfsson et al. (2025) showed that introducing AI in a customer support department raised issues resolved per hour by 14% on average and by 34% for less experienced agents, while experienced agents saw almost no effect. AI’s effect shows up as “pulling the organization’s average toward the level of its experts”. For example, the effect is large in a call center with many new hires and high turnover, or in a review function where junior staff must consult complex standards; it is limited in work that runs on a handful of experts alone.
You can design the accountability and correction mechanisms for when errors occur: As the ruling in Moffatt v. Air Canada (2024) made clear, a company bears the same responsibility for AI output as it does for its employees. A precondition, then, is that the work allows you to design mechanisms to detect errors, correct them, and take responsibility for them. For example, an internal drafting assistant can be corrected in-house when it errs, but a chatbot that answers customers directly turns a wrong answer straight into legal liability.
The work is high-volume and each case is routine: Adopting AI requires fixed upfront investment in evaluation data and integration into the workflow, so the more cases a task processes, the easier it is to recoup that investment. For example, handling thousands of inquiries or hundreds of document reviews a month is a good fit, while a special case that arises only a few times a year is more rationally handled by a human.
How General-Purpose AI Differs from Vertical AI Agents
What, exactly, separates general-purpose AI from vertical AI agents? The two can be distinguished along five dimensions: the market they target, the value they deliver, the knowledge built into them, the unit of use, and the pricing logic.
They target different markets: Providers of general-purpose AI such as OpenAI, Anthropic, and Google (Gemini) frame their mission as “substituting for and augmenting knowledge work globally” and define their target market as the world’s entire knowledge-work wage bill (roughly $25 trillion). Vertical AI agents, by contrast, redefine their target market as the labor spend of a specific industry. For example, Harvey in legal targets “the $1 trillion legal services market (versus roughly $40 billion in traditional software spend)”, and Sierra in customer service targets “$40 billion in customer service spend” (Taima, 2026).
The value they deliver differs: augmentation versus substitution of the process: General-purpose AI delivers augmentation, assisting each employee’s individual work and raising their productivity. Vertical AI agents aim at substitution, taking over a specific business process outright; Sequoia Capital calls this “Service-as-a-Software”, in the sense of “selling the work itself rather than selling software”. For example, general-purpose AI helps a lawyer read a contract faster, whereas a vertical AI agent performs the contract review as a first pass and the lawyer shifts to checking the result.
The knowledge and workflows built into them differ: General-purpose AI delivers the capability of the foundation model itself; the user has to supply the domain-specific knowledge, procedures, and decision criteria. Vertical AI agents layer the industry’s knowledge base, expert-labeled evaluation data, operating procedures, regulatory handling, and integrations with existing business systems on top of the foundation model, and ship all of it as the product. For example, a vertical product for building permit review comes with the structure of the building code, how to read drawings, the operating practices of each inspection agency, and the formats for review records already built in, so users do not have to teach any of it from scratch.
The unit of use differs: the individual versus the business process: General-purpose AI is a tool an individual uses in conversation, and it sits outside the organization’s business processes. Vertical AI agents are embedded inside the business process and operate while exchanging data with business systems. For example, a document produced with general-purpose AI is copied into the business system by hand, whereas a vertical AI agent receives data directly from the review system or the CRM and writes its results back.
The pricing logic differs: General-purpose AI is priced mainly per user (per seat), while vertical AI agents are shifting toward pricing by volume of work processed or by outcome. This reflects the fact that vertical products are going after the labor budget. For example, vertical products in customer service charge “per inquiry resolved”.
Where both markets stand today: Revenue at vertical AI agent companies is growing fast, yet their penetration of the target market remains tiny. For example, Cursor (software development) has roughly $2 billion in annualized revenue, about 0.13% of its target market; Harvey (legal) has $190 million, about 0.02%; Sierra (customer service) has over $150 million, about 0.04%; and OpenEvidence (healthcare) has over $100 million, about 0.4–0.5%. Vertical AI agents are at “the entrance to the entrance of the market”, and they are expected to keep expanding substantially.
Work Suited to General-Purpose AI
Used As Is
This is the model of using conversational AI products not tied to any particular task, such as ChatGPT, Microsoft Copilot, Claude, and Gemini, exactly as they come. The dominant pattern is employees using them to raise their own personal productivity (Bommasani et al., 2021).
Drafting and polishing documents: Getting started on emails, reports, proposals, and other text, and then refining what has been written. In an experiment using ChatGPT for writing tasks, Noy & Zhang (2023) showed that working time fell by about 40% and the quality of the output improved. For example, drafting an English-language email to a customer or polishing the prose of an internal report are uses whose benefits have been confirmed across industries and job types.
Summarizing and organizing information: Extracting the key points from long documents or meetings and structuring them. In their experiment with 758 consultants, Dell’Acqua et al. (2023) showed that on tasks within AI’s strengths, such as ideation, writing, and analysis, consultants completed 12% more tasks, 25% faster, at 40% higher quality. For example, producing minutes from a meeting recording, or condensing a document of several dozen pages into a one-page summary.
Translation and multilingual support: Reading documents in other languages and converting your own text into them. Eloundou et al. (2023) estimated that language-centric occupations, including translation and writing, are the area most strongly affected by large language models. For example, reading a draft contract from an overseas business partner, or producing customer notices in several languages.
Assistance with writing code: Help with writing programs, spreadsheet functions, and scripts. In a controlled experiment, Peng et al. (2023) showed that developers using GitHub Copilot completed a task 55.8% faster than those who did not. For example, building a complex spreadsheet formula, writing a data-aggregation script, or explaining existing code.
Generating outlines and ideas: Producing raw material to start thinking with: the structure of a document, options for a proposal, angles for a question. In the Dell’Acqua et al. (2023) experiment, creative tasks such as generating new product ideas and proposing market segments also fell inside AI’s area of strength. For example, producing several alternative outlines for a presentation, or enumerating the discussion points for a workshop.
Draft replies for routine customer inquiries: Writing responses to frequently asked questions. Brynjolfsson et al. (2025) showed that introducing AI in a customer support department raised issues resolved per hour by 14% on average and by 34% for less experienced agents. For example, drafting replies to routine questions about return procedures or opening hours, which the agent checks and sends.
What these uses share is that they are cross-functional, complete within a single individual’s work, and produce results that the person can check on the spot. They also have limits. As MIT NANDA (2025) described under the label “learning gap”, general-purpose AI products do not remember the context of the work, do not learn from feedback, and do not adapt to your workflows, so they fall out of use on complex, ongoing work (70% of respondents chose AI for simple tasks, but 90% chose humans for complex, long-running work). In addition, “shadow AI”, where employees use personally subscribed products for work, creates governance problems such as confidential information being sent outside the company and unclear accountability; the answer is not a ban but official adoption and clear usage rules (MIT NANDA, 2025; Haag & Eckhardt, 2017).
Customized
In this model, you configure a general-purpose AI product with your own instructions (system prompt), internal documents for it to reference, and internal system functions it can call, assembling it into an “internal assistant” for a specific purpose. It relies on configuration features the product itself provides, such as ChatGPT’s GPTs (OpenAI, 2023), Claude’s Projects (Anthropic, 2024), and Microsoft Copilot Studio (Microsoft, 2023), and it can be set up without writing code.
First-line answers grounded in internal knowledge: Answering questions by referencing knowledge that exists in document form: internal rules, manuals, past Q&A. This is an active research area under the name retrieval-augmented generation (RAG), which retrieves external documents and reflects them in the answer (Lewis et al., 2020), and it can be implemented with the product’s own configuration features. For example, first-line answers to routine questions such as “how do I set up the VPN?” for the IT department or “how do I apply for parental leave?” for HR.
Generating documents in your own formats and tone: Bringing general-purpose AI’s output in line with your own templates and standards of expression. The efficiency gains in document creation that Noy & Zhang (2023) demonstrated can be reproduced across the whole organization, without variation between individuals, by configuring examples and instructions that enforce your standards. For example, unifying the tone of customer emails, or shaping reports into a prescribed heading structure.
Classifying and routing incoming documents: Sorting inquiries and applications by content and determining the responsible department and priority. Brynjolfsson et al. (2018) concluded that tasks with clear inputs and outputs and high frequency are the best suited to machine learning, and classification is the textbook case. For example, classifying the contents of an inquiry form as “billing”, “technical”, or “cancellation” and routing each to the right agent.
Automating individual work that spans several existing tools: Work that cuts across generic business tools such as calendar, email, documents, and spreadsheets. Products such as Microsoft’s (2023) Copilot Studio provide integration features for these business tools. For example, a chain of steps that produces minutes from a meeting recording, registers the decisions in a task management tool, and prepares draft emails for the people involved.
Helping new staff get up to speed: Letting less experienced staff look up procedures and internal terminology on their own. Brynjolfsson et al. (2025) showed that AI’s effect is largest for less experienced staff (a 34% productivity gain), and an assistant that references internal knowledge is designed to capture exactly that effect. For example, letting a new employee check instantly, against the internal rules, “whose approval does this request need?”
There are limits. What this approach can cover is “referencing knowledge”, not “executing work”. It is not suited to embedding in a business process, where the system receives data inside a business system, makes a judgment, and writes the result back (MIT NANDA, 2025). For example, if you give it the review standards to reference, it can answer “how should this provision be interpreted?”, but it cannot perform the work itself: reading the submitted drawings, checking them against the relevant provisions, and producing the review record. Moreover, the quality of the instructions and reference documents you configure, the verification of answer accuracy, and keeping the documents current are all your responsibility; stale reference documents produce a stream of wrong answers, and an update to the foundation model can change the assistant’s behavior (Gao et al., 2023; NIST, 2023). The rational scope for customizing general-purpose AI is therefore “first-line answers that reference internal documents” and “making individual work more efficient”, and once you need embedding in a business process, you should move to a vertical product or an in-house build.
Work Suited to Vertical AI Agents
Used As Is
This is the model of using AI products designed for a specific domain, such as legal document review, clinical documentation support, building permit review, customer support, and accounting, with their standard features and procedures unchanged. These products build the domain’s knowledge, data, workflows, evaluation criteria, and regulatory handling on top of a foundation model, and they assume integration with business systems.
Legal document review and contract analysis: Checking contract clauses, researching case law and statutes, and supporting document drafting. According to Menlo Ventures (2025), legal is the second-largest area of vertical AI spend after healthcare ($650 million), and vertical products such as Harvey build the body of case law, statutes, and contracts into the product. For example, checking the clauses of a commercial contract against your standard terms and presenting the deviations along with the reasoning.
Clinical documentation and access to medical information: Recording consultations and referencing medical literature and guidelines. In Menlo Ventures (2025), healthcare is the largest area of vertical AI spend ($1.5 billion), and products such as OpenEvidence build in medical literature and clinical guidelines. For example, producing a draft clinical note from the consultation conversation, which the physician checks and finalizes.
First-line customer support and execution of transactions: Handling an inquiry as one continuous flow, from intake through looking up customer information, executing transactions such as refunds and booking changes, and logging the record. Products such as Sierra deliver this entire flow integrated with the CRM. The customer support productivity gains that Brynjolfsson et al. (2025) demonstrated also came from AI embedded in the business system. For example, answering a delivery status inquiry by referencing live data in the order management system and, if needed, arranging redelivery.
Software development support and automation: Writing, modifying, reviewing, and testing code. Beyond the 55.8% speed-up that Peng et al. (2023) demonstrated, development-focused products such as Cursor offer completions that understand the whole codebase and edits across multiple files, and this has become the largest area by revenue among vertical AI products. For example, implementing a new feature with an understanding of the existing codebase and generating the tests for it.
Review and cross-checking against regulations and standards: Checking application documents and drawings against laws and standards and determining compliance. Eloundou et al. (2023) showed that work involving rule-based document verification and cross-checking is an area strongly affected by large language models, and vertical products have emerged in these areas that build in the structure of the law, how to read documents and drawings, and the operating practices of each agency. For example, in building permit review, checking the submitted drawings against the building code and producing draft findings that cite the relevant provisions as grounds.
Routine accounting and back-office processing: Processing invoices, making journal entries, checking expenses, and handling various applications. MIT NANDA (2025) reports that while sales and marketing attract the attention, the largest real gains are in the back office, citing cases that produced several million dollars a year in savings on outsourcing and agency fees. For example, reading received invoices, matching them against purchase order data, and posting the journal entries in the accounting system.
What these share is that specialist knowledge, regulation, and industry-specific data formats define the work, so the foundation model’s general capability alone cannot reach professional standards (Dell’Acqua et al., 2023), and that procedures and decision criteria are broadly shared across the industry, so a standard product achieves a high degree of fit (Davenport, 1998; Soh et al., 2000). The “tools deeply integrated into the work that learn over time” that MIT NANDA (2025) named as the hallmark of successful companies are exactly what vertical products are trying to deliver. For example, Morgan Stanley, through its partnership with OpenAI, built a search and summarization system for financial advisors on top of its own library of more than 100,000 research reports; this is a good example of “co-development with a vendor”, sourcing the model layer externally, owning the data layer, and building the workflow layer jointly with the vendor (Morgan Stanley, 2023).
Customized
In this model, you use the configuration options the vertical product provides to reflect your own decision criteria, procedures, formats, and approval flows, and you connect it to your business systems via APIs. The principle of staying within configuration and integration and not touching the product’s code is the same as for conventional software (Brehm et al., 2001).
Reflecting each organization’s decision criteria and formats: Work where the basis for decisions (laws, standards, guidelines) is shared across the industry, but the emphasis, the record formats, and the wording of findings differ from one organization to the next. Strong & Volkoff (2010) classified misalignments between organizations and systems into six types, covering functionality, data, usability, roles, controls, and organizational culture, and showed the need to distinguish what configuration should absorb from what the business side should change.
Integration with existing business systems: Connecting the vertical product to your existing intake system, CRM, document management system, and accounting system to eliminate manual re-entry. As Hasselbring (2000) showed, integration remains maintainable only when it is built within the standard interfaces (APIs) the product provides, rather than by piling up one-off connections. For example, connecting a vertical customer service product to your order management system so the AI can answer return and delivery status inquiries using live data.
Configuring human checkpoints and approval flows: Defining under what conditions a human checks and approves after the AI has done the first pass. The NIST (2023) AI Risk Management Framework calls for human oversight proportionate to the level of risk and for designed procedures to detect and correct errors. For example, requiring that any review finding involving a major non-compliance be confirmed by a reviewer before it is sent to the applicant, or that refunds above a certain amount go through a supervisor’s approval.
Feeding in expert feedback: Using the product’s mechanisms for turning corrections and evaluations from its expert users into product improvements. The customer support AI that Brynjolfsson et al. (2025) analyzed was likewise a mechanism that used the records of experienced agents to give every agent the same know-how.
Setting the scope of data access and permissions: Defining, by department and role, which data the AI may reference and which operations it may perform. NIST (2023) treats clarity about the scope of data handling and access rights as a basic element of AI system governance. For example, letting branch staff reference only their own branch’s customer data while head-office managers see aggregates for the whole company.
The limit is that when the workflow the product assumes differs fundamentally from yours, no amount of configuration will fix it. As with misfit in conventional software (Soh et al., 2000), you must decide whether to change the business side, choose a different product, or carve out the unique portion. When custom processing starts accumulating outside the product, it means one of two things: either “the vertical product does not fit the work” or “that portion is a differentiating core we should build in-house”, and the decision moves to the question of building in-house, discussed next (Brehm et al., 2001).
Work Suited to Building In-House
In this model, you use a foundation model’s API and build your own mechanisms: a system that retrieves and references your own data (RAG), additional training of the model (fine-tuning), or an agent that chains multiple processing steps (Lewis et al., 2020; Bommasani et al., 2021).
A new area where no vertical product exists yet: Your work sits at the “genesis” stage on the market-maturity axis and no suitable vertical product exists yet (Wardley, 2020). Because the vertical product market is expanding rapidly, however (Menlo Ventures, 2025), “none exists today” does not mean “none will exist next year”, and you need to re-examine regularly why you are still building. For example, anomaly detection for equipment and processes unique to your company is work that exists nowhere else even within your industry, and you have no choice but to build it yourself until a product appears.
An area where regulation or confidentiality prevents you from handing data to an external product: Work where regulation prohibits sending customer or confidential data to an external service, so you need a system that runs under your own control. For example, one reason JPMorgan Chase chose to build in-house was that financial regulation prevented it from sending confidential data outside the firm (JPMorgan Chase, 2025). In many cases, though, this constraint can be resolved by how a vertical product is delivered (running inside your own environment, contractual guarantees that your data is not used for training), so you should verify whether building in-house is truly the only option.
Embedding AI in your own product or service: For a company whose service is fundamentally software, the AI embedded in it is, by definition, the core of differentiation (Andreessen, 2011). For example, when you add customer-facing AI features to your own SaaS product, those features are what differentiate you from competitors, and dropping an external vertical product into them unchanged amounts to giving up that differentiation. Even here, though, the usual pattern is to source the model layer externally and build the workflow and data layers yourself.
When deciding whether to build in-house, think of the AI system as three layers: the model layer, the workflow layer, and the data layer. The model layer commoditizes fastest; use it via APIs and keep a design that does not lock you to any one vendor (such as OpenAI or Google). The data layer is the most important complementary asset; whether you build in-house or use a vertical AI product, secure export capability (Teece, 1986). For the workflow layer, the mapping is: general-purpose AI for an individual’s generic work, a vertical product for work shared across the industry, and an in-house build when the work is your differentiating core and no product exists. In domains that touch human life, property, or legal rights, if you cannot build your own expert team for development, maintenance, and evaluation, choose a vertical product that has one (NIST, 2023; Moffatt v. Air Canada, 2024).
A Framework for AI Adoption
Building on everything above, this section lays out a practical, step-by-step framework for deciding how to adopt AI. Two premises underpin it: decisions are made at the level of individual work, not “the whole system,” and no decision is final; each one is revisited on a regular schedule.
Step 1: Break Work Down and Separate Core from Context
Think in units of work, not systems: Framing the question as “Should we build or buy our core enterprise system?” or “Should we adopt AI?” is itself the beginning of failure. A core enterprise system is a bundle of many different kinds of work (accounting, purchasing, inventory, sales, production, and so on), and the right sourcing model differs for each. Start by decomposing the work into pieces fine-grained enough to decide on individually.
Classify each piece of work as core or context: Following Moore’s (2005) distinction, sort each piece of work into work that directly drives why customers choose you (core) and work that is necessary but can be done the same way your competitors do it (context). Frontline staff tend to see their own work as “special and important,” so the classification must be done jointly by leadership and the people doing the work, from the customer’s point of view.
Keep the core small: Only a handful of activities normally qualify as core. Prahalad & Hamel (1990) observe that a company listing more than five or six core competencies has misunderstood the concept, and Moore (2005) argues that because activities migrate from core to context over time, most resources end up consumed by context. If your classification yields a long list of core activities, ask of each one, “Does nobody else do this?” and “Do customers choose us because of it?” Most will move to context. For example, if six out of ten activities come back as core, the bar was almost certainly set too low.
Restrict the scope to work that suits AI: For each piece of work, check the conditions laid out in the “Work Suited to AI in the First Place” section: is it centered on language and documents, can the output be verified, does it fall inside the boundary of AI capability, is there variation in skill levels, can accountability and correction mechanisms be designed, and is the frequency high?
Step 2: Apply the Five Tests
Take the four axes from the previous section, add a feasibility axis, and apply the resulting five tests to each piece of work in order.
The differentiation test: Does doing this work in your own distinctive way create value in the customer’s eyes, resist easy imitation by competitors, and translate into a durable advantage? Answer “yes” only when all four VRIO conditions are met; a “yes” means building in-house is worth considering. A “no” means the remaining tests decide how to buy. For example, Walmart’s replenishment system is a “yes,” but its expense reimbursement is a “no.”
The asset-specificity test: Is the way you perform this work unique to your organization, or essentially the same as your industry peers? If it is the same, adopt an off-the-shelf product; if it is unique, go back and confirm that the uniqueness actually passed the differentiation test. Uniqueness that does not differentiate is a candidate for aligning the work to the standard. For example, the fact that “our approvals have five levels” creates no differentiation, so it is a candidate for conforming to the standard three.
The market-maturity test: How far has the product market for this work evolved? If multiple vendors compete and the functionality is standardized (the product or commodity stage), adopt an off-the-shelf product; if no product exists or the category is immature (the emergent or custom-build stage), build in-house. For example, customer management has a mature product market, whereas optimizing your own idiosyncratic manufacturing process may have no product at all and end up as an in-house build. For AI, check three levels: whether general-purpose AI is enough, whether a vertical product exists, or whether nothing exists.
The pace-of-change test: How quickly do the requirements governing this work change? Where change is fast, off-the-shelf products gain a large advantage because the cost of keeping up is externalized. For example, for work subject to annual regulatory amendments, or work directly affected by advances in foundation models, it is more rational to adopt an off-the-shelf product and leave the catching up to the vendor.
The capability test: Does your organization have the people, budget, and structure to build this system and to keep improving and maintaining it for five or ten years after go-live? If not, then even when the other tests point to building in-house, look instead at customizing an off-the-shelf product or at co-development that gets your requirements built into the vendor’s product. For example, when an organization with only two developers chooses to build in-house, the system’s lifespan ends when those two people leave.
Only work that passes all five tests in favor of building in-house becomes a candidate for an in-house build. If even one test points to an off-the-shelf product, treat that as a warning about the risk of building and consider off-the-shelf options (general-purpose AI or vertical AI agents). The capability test in particular holds a veto that overrides the results of the other four.
Step 3: Evaluate Cost and Value over the Full Lifecycle
Compare total cost of ownership (TCO), not development cost: Looking only at initial development cost grossly understates what building in-house costs. Annual maintenance runs 15–20% of development cost (Boehm, 1981), and maintenance and operations are estimated to account for 50–70% of lifecycle cost (Lientz & Swanson, 1980), rising to 85–90% for enterprise systems (Erlikh, 2000), so ten-year TCO comes to 3–10 times the initial development cost. An estimate for an off-the-shelf product should include, on top of license fees, the cost of changing your processes, maintenance of the integration layer, and the cost of a future migration. For example, Panorama Consulting Group’s (2024) survey puts the median cost of an ERP implementation project at $450,000 (roughly 0.2% of the surveyed companies’ annual revenue), whereas the large custom development projects analyzed by Bloch et al. (2012) had budgets of $15 million or more; compared with product adoption, in-house builds typically run 20–30 times larger. On top of that, the in-house side accrues maintenance and renewal costs of 3–10 times that initial outlay over the years that follow. That said, an off-the-shelf product customized deeply enough can balloon into the same order of magnitude, as the cases of Lidl (roughly €500 million) and Birmingham City Council (over £100 million) demonstrate (Handelsblatt, 2018; Grant Thornton UK LLP, 2023).
Correct estimates with a reference class: Set your own estimate against the actual outcome distribution of comparable projects (Flyvbjerg et al., 2022), and explicitly assess the probability of a cost overrun of 2x or more. If leadership cannot accept that probability, either remove the work from the in-house candidates or split the scope so that no single failure is fatal. For example, given an outcome distribution in which one project in six triples its budget, divide the investment per project down to a size where tripling would not be fatal to the business.
Evaluate exit cost and ease of exit: Whatever the sourcing model, assess how much you would lose before you could stop if things went wrong. Estimate the cost and time required to cancel and switch away from an off-the-shelf product, and to halt an in-house build and move to an alternative, and assign real value to the option to exit (Keil, 1995). The value of that flexibility grows with uncertainty (Fichman, 2004). For example, the option to trial a vertical AI product on a one-year contract and cancel if it delivers nothing simply does not exist when you build the same functionality in-house.
Set the evaluation window with the J-curve in mind: Judging on results from the first one or two years after adoption risks cutting off the complementary investments the project needs. Set an evaluation window of at least five years and budget the complementary investments (process redesign and training) over that period (Brynjolfsson et al., 2021). For example, in the first year after introducing AI-assisted permit review, processing time may actually increase while reviewers get used to the procedure of checking the AI’s findings; labeling that period a “failure” and pulling the plug means abandoning the investment before the gains arrive.
How the cost structure differs for AI: Foundation model APIs are metered by usage, which turns cost from a fixed expense into a variable one. That improves resilience to swings in business performance, but costs rise as usage grows. In McKinsey’s (2026) survey, 20% of companies reported that AI operating costs constrain their usage. At the same time, inference costs keep falling rapidly, so concluding that “running our own model is cheaper” on the basis of today’s prices is dangerous. For example, it is not unusual for the cost per transaction to fall to a fraction of its level within a year, and estimates need to factor in that downward price trend.
Step 4: Set Checkpoints Against the Failure Factors of Each Stage
Against the stage-by-stage failure factors identified in the section on why adoption fails, set the following checkpoints at each stage.
What to confirm at Planning and Investment Decision: Confirm that a ledger exists assigning an adoption level and an owner to each piece of work; that estimates have been corrected using a reference class (the actual outcome distribution of comparable projects) (Flyvbjerg, 2006; Flyvbjerg et al., 2022); that complementary investments such as process redesign, training, and an operating organization have been budgeted (Brynjolfsson et al., 2021); and that the program has been split into units of work rather than built in one piece (Flyvbjerg & Gardner, 2023). These correspond to “choosing the wrong sourcing model,” “the planning fallacy,” “missing complementary investments,” and “scope bloat.” For example, the check is whether, instead of a single approval request titled “core system renewal,” there are separate approval requests for accounting, purchasing, and inventory, each stating its own adoption level, owner, and budget.
What to confirm at Requirements and Product Selection: Confirm that misfits between the product and the work have been surfaced and a decision made for each to either change the work or carve it out (Soh et al., 2000; Davenport, 1998); that vendor continuity, data export mechanisms, and termination conditions have been evaluated (Shapiro & Varian, 1999); and that you have in-house people to own requirements definition and vendor management (Feeny & Willcocks, 1998; Lacity et al., 2009). For AI, additionally confirm that you have run a small-scale trial on real operational data and mapped the boundary of its capability (Dell’Acqua et al., 2023). For example, rather than selecting a product after watching a demo, feed in several dozen of your own past cases, compile a list of where the product failed to process them correctly, and only then sign the contract.
What to confirm at Design, Development, and Customization: Confirm that no custom work amounting to modification of the product itself has crept in and that everything stays within the bounds of configuration and integration (Brehm et al., 2001); that a single party clearly owns overall integration and quality (U.S. Government Accountability Office, 2014); and that repayment of technical debt is planned (Cunningham, 1992; McKinsey, 2020). For example, during development, classify every change request as “can this be handled by configuration, or does it require code?” and make the owner’s sign-off mandatory whenever code is written.
What to confirm at Testing, Migration, and Go-Live: Confirm that load testing, acceptance testing, and data migration validation were carried out as planned (Somers & Nelson, 2001; U.S. Government Accountability Office, 2014); that a phased rollout or parallel running was considered (Markus & Tanis, 2000); and that there is a stage gate for deciding to continue, change, or stop, with the decision-maker separated from the project’s champion (Keil, 1995). For AI, additionally confirm that procedures for detecting and correcting errors, and the locus of accountability, have been established (NIST, 2023; Moffatt v. Air Canada, 2024). For example, have the go-live review chaired by the head of a different department rather than the project’s champion, and document in advance the rule that “we do not go live unless the number of unresolved critical issues from testing is zero.”
What to confirm at Operation, Maintenance, and Evolution: Confirm that a maintenance organization and budget are secured (Lientz & Swanson, 1980; Boehm, 1981); that documentation and knowledge sharing are in place to prepare for staff turnover (Rigby et al., 2016); that business process changes and training have actually been carried out (Aral & Weill, 2007); and that there is a response plan for vendor price increases and product end-of-life (Farrell & Klemperer, 2007). For AI, additionally confirm that there are procedures for keeping up with foundation model updates and deprecations, and continuous monitoring of output quality (NIST, 2023). For example, one year after go-live, check whether the design documents are current, whether maintenance would continue if a single key developer left, and what percentage of licenses are actually in use.
Step 5: Revisit the Decision Regularly
Rerun the market-maturity test annually: For every area you build in-house, ask whether the product market has shifted in the past year. If a product has appeared, revisit the rationale for continuing to build. In AI, vertical products emerge quickly, so every six months is the preferable cadence for this review. For example, an internal document search and summarization system built in-house a year ago “because no product existed” is now very likely matched or exceeded by several products on the market.
Detect the obsolescence of the core: Check whether work that once passed the differentiation test has turned into context as competitors caught up or the industry standardized. For example, an online ordering system that was a unique strength ten years ago is now, in most cases, a standard feature across the industry, and the rationale for continuing to build that part in-house has disappeared.
Reflect changes in people and capability: When key developers leave or the organization restructures, the result of the capability test changes. Depending on the staffing situation, consider scaling back from an in-house build to an off-the-shelf product, or moving to co-development with a product vendor. For example, the moment the architect of an in-house AI system resigns, you should seriously consider migrating to an equivalent vertical product.
The principle when in doubt: For work where the decision is unclear, start with an off-the-shelf product and confirm whether there is room for differentiation while operating it. Moving to an in-house build later is possible, but starting with an in-house build and reverting to an off-the-shelf product later is far harder, because it means writing off the development spend. Under uncertainty, it is rational to start with the reversible option. For example, in AI adoption, the path with the least loss is to begin with general-purpose AI to support individual work, then embed vertical products into business processes, and build in-house only the differentiating core that still remains unfilled.
Closing Remarks
AI adoption has become a mandatory consideration for nearly every company and organization, and many people are weighing the choice between adopting an off-the-shelf product and building in-house, unsure how to decide. I hope this piece serves as a guide for that deliberation and decision.
References
Andreessen, M. (2011, August 20). Why software is eating the world. The Wall Street Journal. Summary: A prominent investor’s essay arguing that the core value delivery of every industry is shifting to software. For companies whose business is software, that software is the core of differentiation.
Anthropic. (2024). Collaborate with Claude on Projects. Anthropic. Summary: Product documentation describing the “Projects” feature, which configures a general-purpose AI product for specific uses by loading company documents and instructions. An example of customizing general-purpose AI without writing code.
Aral, S., & Weill, P. (2007). IT assets, organizational capabilities, and firm performance: How resource allocations and organizational differences explain performance variation. Organization Science, 18(5), 763–780. Summary: Empirical study showing that returns on IT investment are determined not by the amount spent but by the combination of IT asset mix and organizational capabilities (skills, digitized business processes, and a culture of IT use).
Baldwin, C. Y., & Clark, K. B. (2000). Design rules, Vol. 1: The power of modularity. MIT Press. Summary: Foundational text in design theory showing that once a complex system is modularized through standardized interfaces, each module can evolve and be traded independently.
Barney, J. (1991). Firm resources and sustained competitive advantage. Journal of Management, 17(1), 99–120. Summary: The original statement of the resource-based view (VRIO), which holds that sustained competitive advantage arises from resources that are valuable, rare, hard to imitate, and exploited by the organization.
Bessen, J. (2022). The new Goliaths: How corporations use software to dominate industries, kill innovation, and undermine regulation. Yale University Press. Summary: Argues that firms such as Walmart and Amazon have built competitive advantage on proprietary software unavailable on the market, driving industry concentration and stalling new entry. Identifies the conditions under which building in-house becomes a competitive advantage.
Bisbal, J., Lawless, D., Wu, B., & Grimson, J. (1999). Legacy information systems: Issues and directions. IEEE Software, 16(5), 103–111. Summary: Lays out how legacy systems built on old technology obstruct organizational change as maintenance talent dwindles and the technology becomes obsolete, and surveys the options for migrating away from them.
Bloch, M., Blumberg, S., & Laartz, J. (2012). Delivering large-scale IT projects on time, on budget, and on value. McKinsey Quarterly. Summary: Report on a joint study with the University of Oxford analyzing more than 5,400 IT projects, finding that large projects run 45% over budget on average while delivering 56% less value than predicted.
Boehm, B. W. (1981). Software engineering economics. Prentice-Hall. Summary: The classic that introduced the COCOMO model for estimating software development and maintenance costs. Establishes the rule of thumb that annual maintenance after go-live runs at roughly 15–20% of development cost.
Bommasani, R., Hudson, D. A., Adeli, E., Altman, R., Arora, S., von Arx, S., ... Liang, P. (2021). On the opportunities and risks of foundation models. arXiv:2108.07258. Summary: The report that coined the term “foundation model” for large pre-trained models, comprehensively mapping the structure in which diverse applications are built on top of models supplied by a handful of developers, along with its risks.
Brehm, L., Heinzl, A., & Markus, M. L. (2001). Tailoring ERP systems: A spectrum of choices and their implications. Proceedings of the 34th Hawaii International Conference on System Sciences. Summary: Classifies ERP tailoring into nine levels, from configuration to source-code modification, and shows that technical risk, maintenance cost, and loss of vendor support all rise as the level deepens.
Brooks, F. P. (1975). The mythical man-month: Essays on software engineering. Addison-Wesley. Summary: The classic of software development management, home to Brooks’s law: adding people to a late project makes it later.
Brooks, F. P. (1987). No silver bullet: Essence and accidents of software engineering. IEEE Computer, 20(4), 10–19. Summary: Divides the difficulties of software into essential (complexity, conformity, changeability, invisibility) and accidental, and argues that no tool or method can eliminate the former.
Brynjolfsson, E., Li, D., & Raymond, L. (2025). Generative AI at work. Quarterly Journal of Economics, 140(2), 889–942. Summary: Large-scale empirical study showing that deploying generative AI in a customer support organization raised productivity by 14% on average, with the largest gains among less experienced agents.
Brynjolfsson, E., Mitchell, T., & Rock, D. (2018). What can machines learn, and what does it mean for occupations and the economy? AEA Papers and Proceedings, 108, 43–47. Summary: Organizes the conditions that make a task suitable for machine learning (clear inputs and outputs, frequency, availability of feedback, and so on) into an evaluation rubric and estimates applicability by occupation.
Brynjolfsson, E., Rock, D., & Syverson, C. (2021). The productivity J-curve: How intangibles complement general purpose technologies. American Economic Journal: Macroeconomics, 13(1), 333–372. Summary: Shows that the returns to general-purpose technologies trace a “J-curve”: they are invisible at first because complementary investment in intangibles must come before them, and accelerate later.
Capital One. (2020, December 1). Capital One completes migration to the cloud and closes its last data center \[Press release\]. Summary: Corporate announcement that the major US bank had closed all eight of its data centers and moved its infrastructure entirely to AWS. A case of externalizing the infrastructure layer in a regulated industry.
Carr, N. G. (2003). IT doesn't matter. Harvard Business Review, 81(5), 41–49. Summary: Argues that IT, like electricity and railroads, has become commoditized infrastructure that confers no competitive advantage on its own, so firms should focus on minimizing spend and managing risk.
Christensen, C. M., & Raynor, M. E. (2003). The innovator's solution: Creating and sustaining successful growth. Harvard Business School Press. Summary: Introduces the “law of conservation of attractive profits”: when one layer of a value chain becomes modular and commoditized, profits migrate to the adjacent layers.
Cunningham, W. (1992). The WyCash portfolio management system. OOPSLA '92 Experience Report. Summary: The report that first used the metaphor of “technical debt” to describe how design compromises taken as short-term shortcuts keep raising the cost of later change.
Davenport, T. H. (1998). Putting the enterprise into the enterprise system. Harvard Business Review, 76(4), 121–131. Summary: Argues that ERP systems embed the vendor’s assumptions about how work should be done, forcing adopters into a strategic choice between bending the system to the business or the business to the system.
Dell'Acqua, F., McFowland, E., Mollick, E. R., Lifshitz-Assaf, H., Kellogg, K., Rajendran, S., Krayer, L., Candelon, F., & Lakhani, K. R. (2023). Navigating the jagged technological frontier: Field experimental evidence of the effects of AI on knowledge worker productivity and quality (Working Paper No. 24-013). Harvard Business School. Summary: Field experiment with 758 consultants showing that the boundary of AI capability is “jagged”: inside the frontier productivity rose sharply, while outside it accuracy fell.
Eloundou, T., Manning, S., Mishkin, P., & Rock, D. (2023). GPTs are GPTs: An early look at the labor market impact potential of large language models. arXiv:2303.10130. Summary: Estimates that about 80% of US workers could see at least 10% of their tasks affected by large language models, and about 19% could see 50% or more, establishing AI as a general-purpose technology.
Erlikh, L. (2000). Leveraging legacy system dollars for e-business. IT Professional, 2(3), 17–23. Summary: Estimates that maintenance and operations account for 85–90% of the lifecycle cost of enterprise systems, highlighting the scale of legacy upkeep.
Farrell, J., & Klemperer, P. (2007). Coordination and lock-in: Competition with switching costs and network effects. In M. Armstrong & R. Porter (Eds.), Handbook of industrial organization (Vol. 3, pp. 1967–2072). Elsevier. Summary: Theoretical synthesis of how switching costs and network effects shape market competition, showing the mechanism by which switching costs hand pricing power to suppliers.
Feeny, D. F., & Willcocks, L. P. (1998). Core IS capabilities for exploiting information technology. Sloan Management Review, 39(3), 9–21. Summary: Identifies nine core capabilities (business systems thinking, contract monitoring, vendor development, and others) that must stay in-house even when the IT function is outsourced. The basis for the buyer-side capabilities discussed here.
Ferdows, K., Lewis, M. A., & Machuca, J. A. D. (2004). Rapid-fire fulfillment. Harvard Business Review, 82(11), 104–110. Summary: Analyzes how Zara (Inditex) runs a two-week design-to-shelf operating model in tandem with simple information systems it built itself, showing how a system fully fitted to the operating model produces competitive advantage.
Fichman, R. G. (2004). Real options and IT platform adoption: Implications for theory and practice. Information Systems Research, 15(2), 132–154. Summary: Applies real-options thinking to highly uncertain IT investments, offering a framework for valuing flexibility by investing in stages while preserving the options to exit or expand.
Flyvbjerg, B. (2006). From Nobel Prize to project management: Getting risks right. Project Management Journal, 37(3), 5–15. Summary: Proposes reference class forecasting, which corrects estimates against the actual outcome distribution of similar projects, as a remedy for the planning fallacy.
Flyvbjerg, B., & Budzier, A. (2011). Why your IT project may be riskier than you think. Harvard Business Review, 89(9), 23–25. Summary: Analysis of 1,471 IT projects finding an average cost overrun of 27%, but with one project in six a “black swan” with cost overruns of 200% and schedule overruns of 70%.
Flyvbjerg, B., & Gardner, D. (2023). How big things get done: The surprising factors that determine the fate of every project, from home renovations to space exploration and everything in between. Currency. Summary: Cross-sectional analysis of outcome data from megaprojects of every kind, showing that modular projects assembled from small repeated units have a markedly thinner tail of cost overruns than monolithic ones.
Flyvbjerg, B., Budzier, A., Lee, J. S., Keil, M., Lunn, D., & Bester, D. W. (2022). The empirical reality of IT project cost overruns: Discovering a power-law distribution. Journal of Management Information Systems, 39(3), 607–639. Summary: Analysis of 5,392 IT projects showing that cost overruns follow a power-law (fat-tailed) distribution, and warning that estimates premised on a normal distribution badly underestimate extreme overruns.
Gao, Y., Xiong, Y., Gao, X., Jia, K., Pan, J., Bi, Y., Dai, Y., Sun, J., Wang, M., & Wang, H. (2023). Retrieval-augmented generation for large language models: A survey. arXiv:2312.10997. Summary: Systematic survey of retrieval-augmented generation (RAG) methods and open problems, showing that the quality and freshness of reference documents and retrieval errors determine answer accuracy.
Grant Thornton UK LLP. (2023). Birmingham City Council: Statutory recommendations under Section 24 of the Local Audit and Accountability Act 2014. Summary: External auditor’s report on the budget overrun and breakdown of financial controls in Birmingham City Council’s Oracle implementation, naming excessive customization as a principal cause.
Haag, S., & Eckhardt, A. (2017). Shadow IT. Business & Information Systems Engineering, 59(6), 469–473. Summary: Defines “shadow IT,” systems adopted by departments or individuals outside the IT function’s oversight, and surveys its effects on control, security, and data quality.
Hammer, M. (1990). Reengineering work: Don't automate, obliterate. Harvard Business Review, 68(4), 104–112. Summary: The origin of business process reengineering, arguing that firms should redesign work itself rather than automate existing procedures as they stand.
Handelsblatt. (2018, July). Lidl stoppt Milliardenprojekt mit SAP. Handelsblatt. Summary: News report on Lidl’s cancellation of its SAP implementation after seven years and roughly €500 million, attributing the failure to excessive customization driven by its insistence on its own inventory valuation method.
Hasselbring, W. (2000). Information system integration. Communications of the ACM, 43(6), 32–38. Summary: Surveys the challenges of integrating heterogeneous systems within an enterprise, showing how piling up point-to-point connections becomes unmaintainable and why an integration platform is needed.
Hertz Corp. v. Accenture LLP, No. 1:19-cv-03508 (S.D.N.Y. filed Apr. 19, 2019). Summary: Lawsuit in which Hertz sued the outsourced developer of its website and apps for a refund of fees paid plus damages, citing defective deliverables. Illustrates the points of dispute between buyer and contractor over requirements, testing, and acceptance.
Hofmann, H. F., & Lehner, F. (2001). Requirements engineering as a success factor in software projects. IEEE Software, 18(4), 58–66. Summary: Empirical study finding that the effort invested in requirements definition and the degree of stakeholder involvement are the strongest predictors of software project success or failure.
House of Commons Committee of Public Accounts. (2013). The dismantled National Programme for IT in the NHS (Nineteenth Report of Session 2013–14). The Stationery Office. Summary: Parliamentary report examining the costs and lessons after the dismantling of the UK NHS’s electronic patient record programme (NPfIT), summing up the problems of centralized, giant bespoke development.
JPMorgan Chase. (2025). LLM Suite named 2025 "Innovation of the Year" by American Banker. JPMorgan Chase Technology Blog. Summary: Corporate publication describing the rollout history and scale of use of “LLM Suite,” an in-house tool that runs external foundation models on the bank’s internal platform.
Kahneman, D., & Tversky, A. (1979). Intuitive prediction: Biases and corrective procedures. TIMS Studies in Management Science, 12, 313–327. Summary: Identifies the “planning fallacy,” in which planners estimate from the inside view while ignoring similar past cases, and proposes correction through the outside view.
Keil, M. (1995). Pulling the plug: Software project management and the problem of project escalation. MIS Quarterly, 19(4), 421–447. Summary: Analyzes the drivers of “escalation,” in which IT projects visibly heading for failure are continued and given further funding, and shows the need for mechanisms that force exit decisions.
Koch, C. (2002). Hershey's bittersweet lesson. CIO Magazine. Summary: Reports how Hershey, whose 1999 big-bang ERP cutover caused shipping failures, completed its 2002 major upgrade ahead of schedule and under budget through phased migration in the off-season and thorough testing.
Koch, C. (2004). Nike rebounds: How (and why) Nike recovered from its supply chain disaster. CIO Magazine. Summary: Reports how Nike, after its failed demand-forecasting system rollout in 2000, switched its core systems overhaul to a phased rollout by region and function and completed it by 2006 without major incident.
Lacity, M. C., Khan, S. A., & Willcocks, L. P. (2009). A review of the IT outsourcing literature: Insights for practice. Journal of Strategic Information Systems, 18(3), 130–146. Summary: Systematic review of empirical research on IT outsourcing, distilling for practitioners the superiority of selective outsourcing, the role of contract design, and the importance of buyer-side capabilities.
Lehman, M. M. (1980). Programs, life cycles, and laws of software evolution. Proceedings of the IEEE, 68(9), 1060–1076. Summary: Formulates the “laws of software evolution”: a program in real use loses satisfaction unless it is continually changed, and continual change drives up its complexity.
Lewis, P., Perez, E., Piktus, A., Petroni, F., Karpukhin, V., Goyal, N., ... Kiela, D. (2020). Retrieval-augmented generation for knowledge-intensive NLP tasks. Advances in Neural Information Processing Systems, 33, 9459–9474. Summary: The paper that proposed retrieval-augmented generation (RAG), which retrieves external documents and feeds them into a language model’s generation. The foundational technique for AI that references internal documents.
Lientz, B. P., & Swanson, E. B. (1980). Software maintenance management: A study of the maintenance of computer application software in 487 data processing organizations. Addison-Wesley. Summary: Classic large-scale survey of corporate software maintenance activity, the first to show systematically that more than half of lifecycle cost goes to maintenance.
Markus, M. L., & Tanis, C. (2000). The enterprise system experience: From adoption to success. In R. W. Zmud (Ed.), Framing the domains of IT management: Projecting the future through the past (pp. 173–207). Pinnaflex. Summary: Organizes enterprise system adoption into chartering, project, shakedown, and onward phases, describing the problems of each and showing why big-bang cutovers tend to produce turmoil immediately after go-live.
McKinsey & Company. (2020). Tech debt: Reclaiming tech equity. McKinsey Digital. Summary: Survey-based report on CIOs finding that 10–20% of new-development budgets go to paying down technical debt, and that the debt is holding back new development.
McKinsey & Company. (2026). The state of AI: Global survey 2026. QuantumBlack, AI by McKinsey. Summary: Survey of 1,719 respondents in 97 countries reporting that AI adoption has reached 88% while only 37% of companies report an impact on EBIT; that 80% of respondents feel personal productivity gains; that 32% of companies chose to build in-house with AI coding tools; and that 20% see AI operating costs as a constraint on use.
Menlo Ventures. (2025). 2025: The state of generative AI in the enterprise. Menlo Ventures. Summary: Analysis of enterprise generative AI spending reporting a sharp shift toward buying since the prior year (76% external products versus 24% in-house builds), vertical AI spending reaching $3.5 billion, and only 16% of companies running autonomous agents in production.
Microsoft. (2023). Microsoft Copilot Studio: Build your own copilots. Microsoft. Summary: Product documentation describing a feature that configures a general-purpose AI product with company data and integrations to business tools to compose assistants for specific uses.
MIT NANDA. (2025). The GenAI divide: State of AI in business 2025. Massachusetts Institute of Technology. Summary: Based on interviews with 52 organizations and a survey of 153 people, reports that 95% of generative AI pilots have produced no P&L impact, that external products reach production at twice the rate of in-house builds (67% versus 33%), and that a “learning gap” blocks adoption.
Moffatt v. Air Canada, 2024 BCCRT 149 (Civil Resolution Tribunal of British Columbia, 2024). Summary: Canadian tribunal ruling holding the airline liable for incorrect guidance given by its chatbot and ordering compensation.
Moore, G. A. (2005). Dealing with Darwin: How great companies innovate at every phase of their evolution. Portfolio. Summary: Divides a company’s activities into “core,” which creates differentiation, and “context,” which is necessary but does not, and argues that every activity migrates from core to context over time.
Morgan Stanley. (2023, September 18). Morgan Stanley Wealth Management announces key milestone in innovation journey with OpenAI [Press release]. Summary: Corporate announcement of the build and rollout, in partnership with OpenAI, of an AI assistant for financial advisors grounded in the firm’s own research reports.
Nelson, P., Richmond, W., & Seidmann, A. (1996). Two dimensions of software acquisition. Communications of the ACM, 39(7), 29–35. Summary: Applies transaction cost theory to software procurement, mapping the fit of package purchase, custom development, in-house development, and outsourcing along two axes: uniqueness of the work and uncertainty of requirements.
Netflix. (2016, February 11). Completing the Netflix cloud migration. Netflix. Summary: Corporate report that the migration to AWS begun after a 2008 database failure was completed in 2016 with the closure of the last company-owned data center. A case of entrusting the platform to an outside provider while building the differentiating core in-house.
NIST. (2023). Artificial Intelligence Risk Management Framework (AI RMF 1.0). National Institute of Standards and Technology. Summary: US public guidance that frames AI system risk through four functions: govern, map, measure, and manage. Used as a reference standard for designing output verification, accountability, and continuous monitoring.
Noy, S., & Zhang, W. (2023). Experimental evidence on the productivity effects of generative artificial intelligence. Science, 381(6654), 187–192. Summary: Experiment on writing tasks using ChatGPT showing that task time fell by about 40% while output quality improved.
OpenAI. (2023, November 6). Introducing GPTs. OpenAI. Summary: Product announcement of a feature for creating purpose-specific “GPTs” by configuring a general-purpose AI product with instructions, reference documents, and external functions.
Panorama Consulting Group. (2023). The 2023 ERP report. Panorama Consulting Group. Summary: Annual report based on an ongoing survey of ERP adopters covering budget and schedule overrun rates and goal attainment. Shows that around half of ERP implementations exceed budget or schedule, and fewer than half fully realize the expected benefits.
Panorama Consulting Group. (2024). The 2024 ERP report. Panorama Consulting Group. Summary: Annual survey of 131 ERP-adopting companies. Cited for data on the typical scale of investment in off-the-shelf products, including a median implementation cost of about $450,000 (roughly 0.2% of the respondents’ median annual revenue of about $200 million).
Peng, S., Kalliamvakou, E., Cihon, P., & Demirer, M. (2023). The impact of AI on developer productivity: Evidence from GitHub Copilot. arXiv:2302.06590. Summary: Controlled experiment with 95 developers showing that the group using AI coding assistance completed the task 55.8% faster than the group without it.
Prahalad, C. K., & Hamel, G. (1990). The core competence of the corporation. Harvard Business Review, 68(3), 79–91. Summary: Conceptualizes “core competence” as the source of corporate competitiveness. States that a company listing more than five or six core competencies has misunderstood the idea, which grounds this article’s position that the core must be kept to a few things.
Quinn, J. B., & Hilmer, F. G. (1994). Strategic outsourcing. Sloan Management Review, 35(4), 43–55. Summary: Proposes “strategic outsourcing”: keep in-house only the activities in which the firm can be best in the world, and source everything else from best-in-the-world external suppliers for each activity.
Redman, T. C. (1998). The impact of poor data quality on the typical enterprise. Communications of the ACM, 41(2), 79–82. Summary: Surveys the effects of poor data quality on operating costs, decision-making, and customer satisfaction, and argues that data quality management should be a precondition for system adoption.
Rigby, P. C., Zhu, Y. C., Donadelli, S. M., & Mockus, A. (2016). Quantifying and mitigating turnover-induced knowledge loss: Case studies of Chrome and a project at Avaya. Proceedings of the 38th International Conference on Software Engineering, 1006–1016. Summary: Quantifies the software knowledge lost when developers leave, showing that the share of code understood by only one person determines maintenance risk.
Shapiro, C., & Varian, H. R. (1999). Information rules: A strategic guide to the network economy. Harvard Business School Press. Summary: The standard practitioner’s guide to information economics, systematically covering the economic properties of information goods: switching costs, lock-in, network effects, and standardization.
Slaughter and May. (2019). Independent review of TSB's 2018 IT migration. Commissioned by the TSB Board. Summary: Independent review of TSB bank’s 2018 core banking migration failure, identifying as the principal cause the decision to proceed with a big-bang cutover while the build and testing of the new platform were still inadequate.
Soh, C., Kien, S. S., & Tay-Yap, J. (2000). Enterprise resource planning: Cultural fits and misfits: Is ERP a universal solution? Communications of the ACM, 43(4), 47–51. Summary: Analysis of ERP adoption in hospitals that classifies product-organization misfits into three types (data, function, and output) and shows that resolving them through customization inflates long-term costs.
Somers, T. M., & Nelson, K. (2001). The impact of critical success factors across the stages of enterprise resource planning implementations. Proceedings of the 34th Hawaii International Conference on System Sciences. Summary: Surveys the critical success factors of ERP implementation stage by stage, ranking the importance of top management support, data accuracy, software testing, training, and others.
Standish Group. (2015). CHAOS report 2015. The Standish Group International. Summary: Ongoing survey of the proportions of software projects that succeed, are challenged, or fail. Shows the success rate hovering around 30%.
Standish Group. (2020). CHAOS 2020: Beyond infinity. The Standish Group International. Summary: The 2020 edition of the CHAOS report, known for showing that success rates have barely moved in more than 20 years and for naming the curbing of decision latency as a success factor.
Strong, D. M., & Volkoff, O. (2010). Understanding organization–enterprise system fit: A path to theorizing the information technology artifact. MIS Quarterly, 34(4), 731–756. Summary: Extends the taxonomy of misfits between enterprise systems and organizations to six types (functionality, data, usability, role, control, and organizational culture) and theorizes “organization-system fit.”
Taima, M. (2026, June 12). AIエージェント企業はどれだけ大きな市場を狙うべきか — TAMの理論・事例・最新研究 [How big a market should AI agent companies target? Theory, cases, and recent research on TAM]. mign. https://www.mign.io/articles/57854/ Summary: Column mapping how general-purpose AI companies (OpenAI, Anthropic, Google) target all of knowledge work while vertical AI agent companies (Harvey, Cursor, Sierra, OpenEvidence, and others) target the labor spend of specific industries, and quantitatively comparing each company’s revenue, target market, and penetration under the concept of Service-as-a-Software.
Teece, D. J. (1986). Profiting from technological innovation: Implications for integration, collaboration, licensing and public policy. Research Policy, 15(6), 285–305. Summary: One of the most important works in technology strategy, setting out the conditions under which the profits from innovation flow not to the inventor but to whoever holds the complementary assets needed for commercialization.
U.S. Government Accountability Office. (2014). Healthcare.gov: Ineffective planning and oversight practices underscore the need for improved contract management (GAO-14-694). Summary: GAO audit of the failed launch of Healthcare.gov, citing the absence of a systems integrator with overall responsibility, frequent requirement changes, and insufficient testing.
U.S. Government Accountability Office. (2016). Information technology: Federal agencies need to address aging legacy systems (GAO-16-468). Summary: GAO audit reporting that roughly three quarters of the US federal IT budget goes to operations and maintenance, and that the retirement of staff who maintain systems written in decades-old languages is an imminent risk.
Wardley, S. (2020). Wardley maps: Topographical intelligence in business. Creative Commons (published online). Summary: Systematizes a method for mapping the components of a business and choosing the right sourcing approach at each stage, premised on technologies and activities evolving from genesis through custom-built and product to commodity.
Williamson, O. E. (1985). The economic institutions of capitalism: Firms, markets, relational contracting. Free Press. Summary: Foundational text of transaction cost economics, refining the argument that three factors (asset specificity, uncertainty, and frequency) determine whether a transaction should be internalized or left to the market.
Zylo. (2023). 2023 SaaS Management Index. Zylo. Summary: Analysis of corporate SaaS contract data reporting that about 40% of licensed seats go unused, wasting roughly $17 million per company per year.
已读
接下来阅读 ↓